| Admin | Co-admin | Asset Manager | Viewer | ||
|---|---|---|---|---|---|
| Agents | View | ||||
| Add | |||||
| Edit | (Agent Name Blocked) | ||||
| Delete |
This table shows the status of activated agents
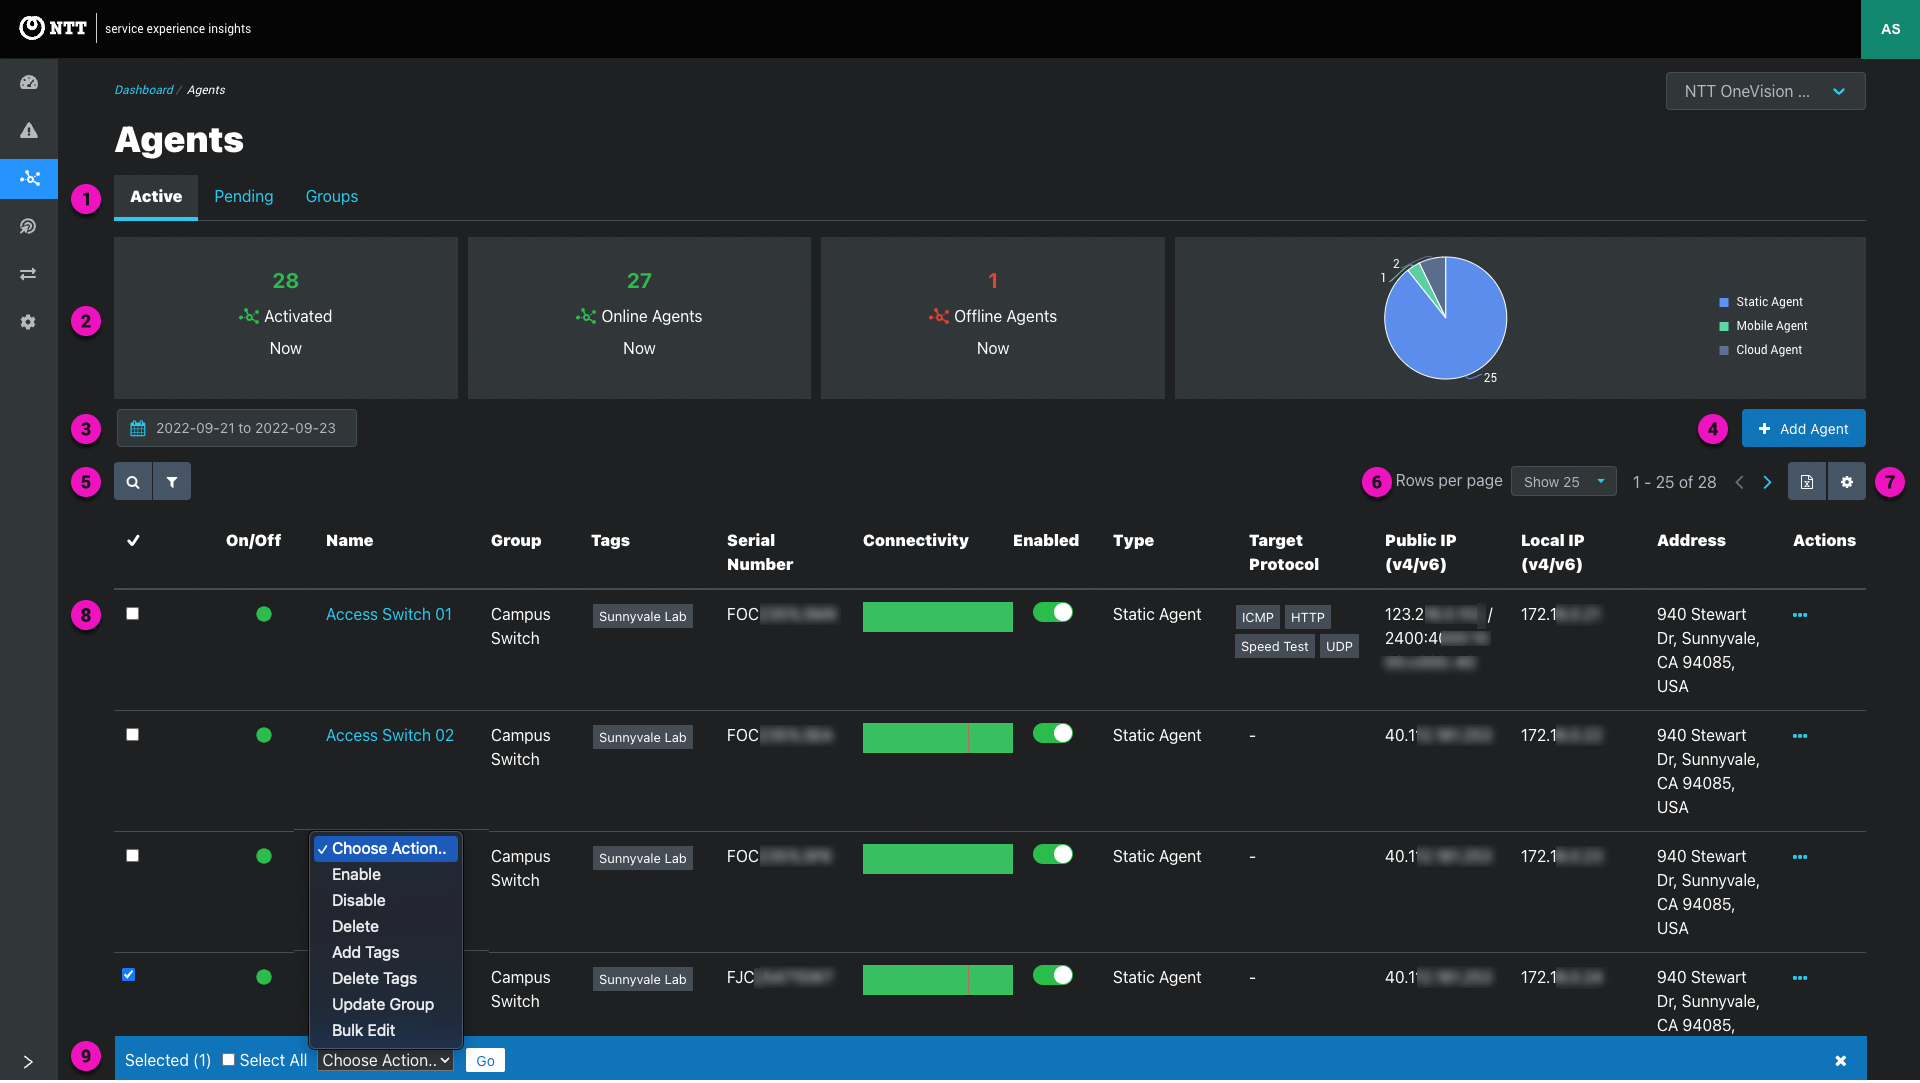
1. Page tabs - View active agents, pending agents, and agent groups.
2. Info panels - Panels summarize the current count of activated, online, offline, and agent types.
3. Date selector
4. Add agents button - Click to open the add agent modal. See Adding Agents.
5. Search and filters
Search - Click the icon to expand text search to quickly find agents by a variety of agent attributes.

| Attributes | Usage note |
|---|---|
| Location | - Agent’s primary location - Search by any part of the agent’s primary address like street name or county - Latitude/longitude is not searchable. Lat/long input as the agent’s location resolves to the nearest address |
| Agent ID | - Agent ID is the agent’s unique identifier - Lowercase and hyphenated agent name appended with a unique six-digit alphanumeric string in this format: “vlan-infra-monitor-agent-rtph29” Searchable by all, or part of the unique identifier string |
| ISP | - Search by the last ISP reported by the agent |
| ASN number | - Search must include “AS” and all partial numbers - AS8075 and AS8 is searchable, 8075 is not |
| Contact email | - Search by all or partial email address - Searching by the email’s domain is helpful to find agents owned by multiple people in an organization - Exact match filter also supported |
| Contact name | - Search by all or part of the contact’s full name Unlike the contact’s email, their name is not required when adding new agents. Search by email if the contact name returns no agents |
| Group | - Search by all or part of group name - Use filters to return agents from multiple groups |
| Host Device Make | - Search by device manufacturer such as “Dell,” “Cisco,” “Apple,” “Juniper,” etc. |
| Host Device Model | - Search by device model: “Latitude,” “C9300L”, “Microsoft Virtual Machine,” “Raspberry Pi4”, etc. |
| Host Name | - Search by all or part of the host device’s name |
| Local IP (v4 or v6) | - Search by all are part of the local IP - Partial searches are useful to find agents in the same IP address allocation |
| OS | - Search by Linux, Windows, Mac, or EdgeLQ - Linux and EdgeLQ return cloud agents and static agents on hosts running the EdgeLQ OS - Static agents running as a Docker container on application-hosting devices do not return the host’s OS and are not searchable by OS - Use filters to return agents from more than one OS |
| Public IP (v4 or v6) | - Search by all are part of the public IP - Partial searches are useful to find agents in the same IP address allocation |
| Serial number | - Host device serial number returned by the agent - Use filters to find agents from multiple tags |
| Tags | - Name of tags - Use filters to return agents from multiple tags |
| Type | - Search Cloud agents, mobile agents, static agents - Use filters to return multiple types of agents |
| Version | - Agent software version number like “v3.0.1” Useful for finding out-of-date agents requiring software upgrade Filters support exact match. Use the version filter to return agents from multiple software releases - Example: Combine a group name with the version filter to return all agents in a group with obsolete software |
Filters - Click the icon to use filters. Multiple filters create and statements.
| Filter Key | Operator | Filter options | Example | Usage tip |
|---|---|---|---|---|
| equals | Text (exact match) |  | Use text search if the exact email address is unknown | |
| Enabled | equals | True, False (single select) |  | - Combine a text search and other filters with the enabled filter create a list of agents to enable or disable. - Check one of the agents to open the bulk edit footer - Check “Select All” in the bulk editor - Enable or disable all the selected agents |
| Group | Contains | Groups list (multi-select) |  | - Filter by groups - Filter by “No Group Assigned” to find ungrouped agents for editing |
| Name | equals | Text (exact match) |  | Use text search if the exact spelling of the name is unknown |
| On/Off | equals | Online Agents, Offline Agents (single select) |  | Filter the by “Offline Agents” to quickly identify which agents are currently offline |
| OS | contains | Linux, macOS, Windows (multi-select) |  | Linux filter returns cloud agents and static agents hosted on dedicated hardware running the EdgeLQ OS. Static agents running on application-hosting devices are not filterable by OS - macOS and Windows filter returns mobile agents |
| Serial Number | equals | Text (exact match) |  | Finding agents by host serial number is helpful for when troubleshooting issues reported by systems that use different host device naming conventions |
| Tags | contains any | Tags list (multi-select) |  | Filter by tags assigned to agents |
| Target ICMP Enabled | equals | True (single-select) |  | Return only ICMP managed targets or combine with the speed test and UDP target filters to view all managed targets |
| Target Speed Test Enabled | equals | True (single-select) |  | Return only Speed Test managed targets or combine with the ICMP and UDP target filters to view all managed targets |
| Target UDP Enabled | equals | True (single-select) |  | Return only UDP managed targets or combine with the ICMP and speed test target filters to view all managed targets |
| Type | equals | Cloud Agent, Mobile Agent, Static Agent (multi-select) |  | Filtering by agent is useful for viewing network segments that require a unique agent type such as: - Public Cloud environments that use cloud agents - Remote Worker PCs that rely on mobile agents |
| Version | equals | Text (exact match) |  | Filtering agents by agent software version is useful for finding agents running out-of-date software |
6. Pagination

7. Table Sorting
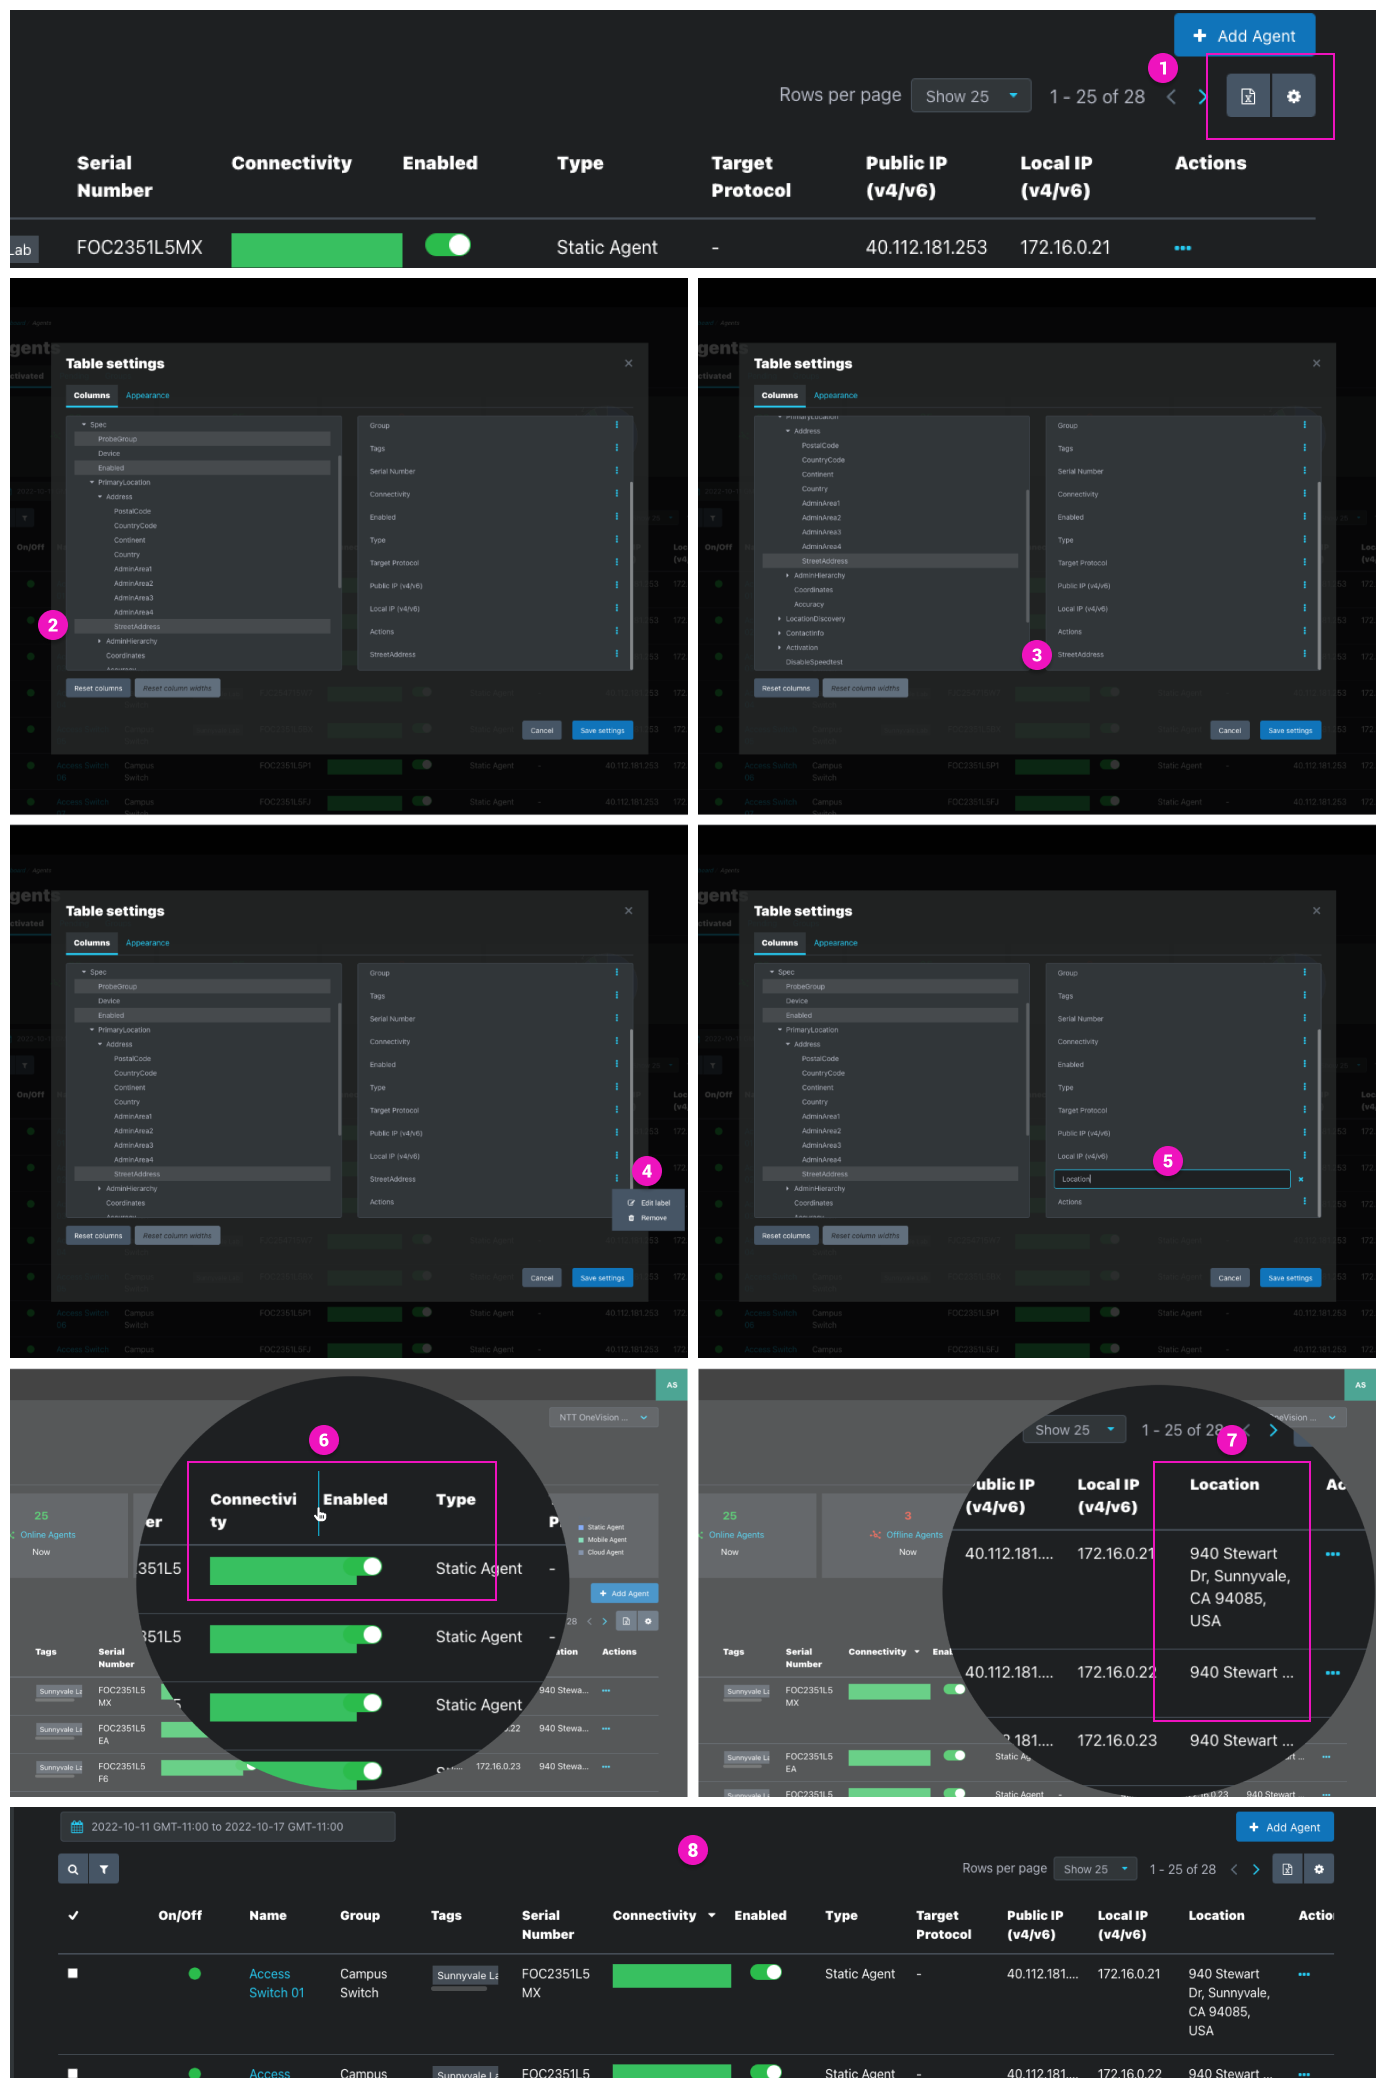
8. Table export and customization
Table customization is explained in the following example of adding agent location to the table
8. Agent list
| Column | Displayed Value |
|---|---|
| Checkbox for selecting agents for bulk editing | |
| On/off | Online Agent –Agent successfully connected to the controller Offline Agent –Agent not connected to the controller |
| Name | - Agent’s display name link - Click through to the agent record to view metrics and information about the agent |
| Group | Group assigned to the agent |
| Tags | Tags assigned to the agent |
| Serial Number | - Host device serial number for static or mobile agents - VM serial number for cloud agents |
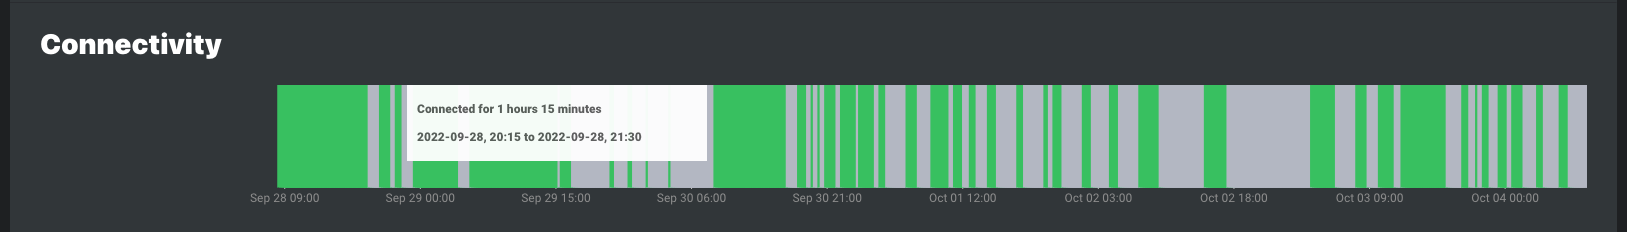
| Connectivity | - Connectivity graphic shows agent connectivity for the dates shown in the date selector - Green indicates when the agent was online - Red shows when static, and cloud agents were disconnected - Gray shows when mobile agents were disconnected. Gray is used for mobile agents because they are expected to be offline when the host PC is not in use - Hover over a colored section to view when and how long the agent was connected or experienced a connectivity issue |
| Enabled | Agent Enabled, Agent Disabled - Toggle agents from enabled to disabled - Enable or disable multiple agents using bulk edit - This action is also available on the agent page and agent editing modal |
| Type | Type of agent –Cloud agent, mobile agent, or static agent |
| Target Protocol | - Target protocol(s) enabled for managed target agents - Managed targets support ICMP, UDP, and/or Speed Test target protocols - Static and cloud agents with target functionality enabled become managed target agents |
| Public IP(v4/v6) | - Last public IP returned by the agent - Displays the agent’s public IPv4 address. IPv6 displayed if available - Public IP not displayed for disabled agents |
| Local IP(v4/v6) | - Last local IP returned by the agent - Displays the agent’s local IPv4 address. IPv6 displayed if available - External IP not displayed for disabled agents |
| Location | - Agent’s primary location - Full or partial address shown - Lat/long input as the agent’s location resolves to the nearest address |
| Actions | ellipsis icon to open the actions menu Edit opens the editing modal Delete opens the confirm deletion modal |
9. Agent selector and bulk editing on active and pending agent tables
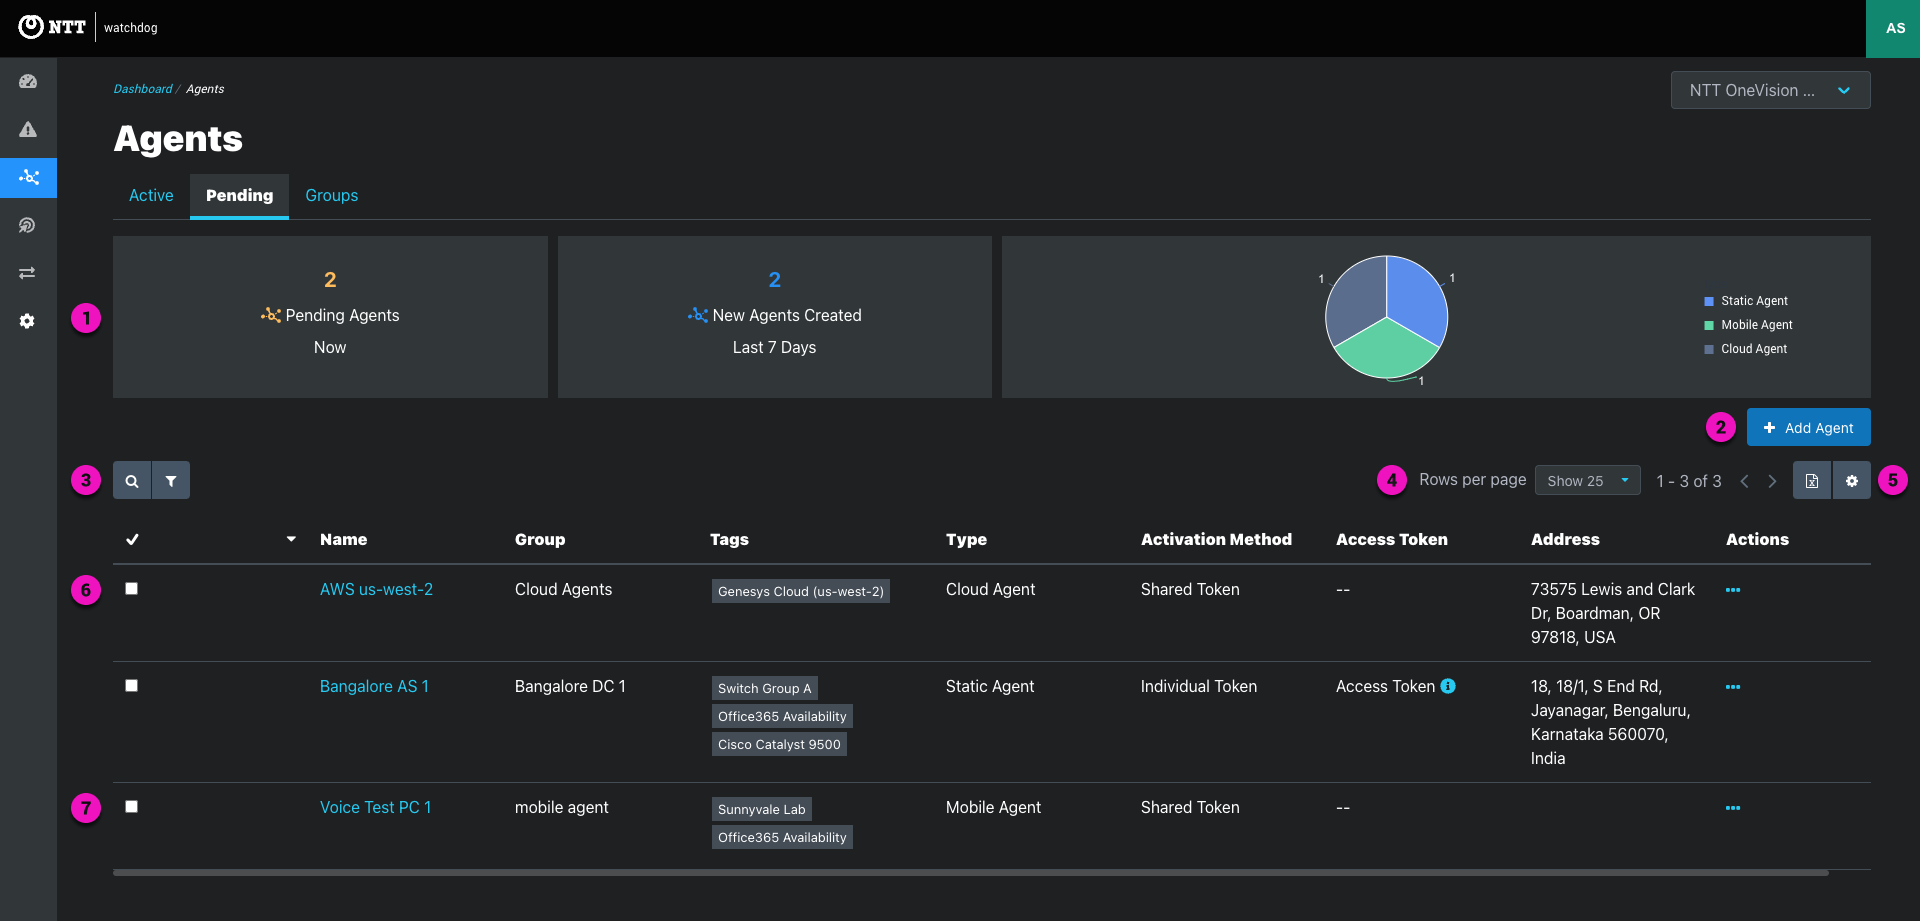
1. Info panels - Panels summarize the current count of pending agents, new agents created over the last seven days, and the count of pending agents by agent types.
2. Add agents button - Click to open the add agent modal.
3. Search and filters - Filter visible agents by text search or context filters like Group, Tag, OS, Online/Offline, etc.
| Filter Key | Operator | Filter Option | Example | Usage Note |
|---|---|---|---|---|
| Activation status | equals | Inactive, Invitation Pending |  | All pending agents are inactive - Pending agents utilizing emailed individual token activation are marked as Invitation Pending - Use this filter to view or excluded this unique activation status |
| equals | Text (exact match) |  | Use text search if the exact email address is unknown | |
| Group | Contains | Groups list (multi-select) |  | - Filter by groups - Filter by “No Group Assigned” to find ungrouped agents for editing |
| Name | equals | Text (exact match) |  | Use text search if the exact spelling of the name is unknown |
| Tags | contains Any | Tags list (multi-select) |  | Filter by tags assigned to agents |
| Target ICMP Enabled | equals | True (single-select) | | Return only ICMP managed targets or combine with the speed test and UDP target filters to view all managed targets |
| Target Speed Test Enabled | equals | True (single-select) | | Return only Speed Test managed targets or combine with the ICMP and UDP target filters to view all managed targets |
| Target UDP Enabled | equals | True (single-select) | | Return only UDP managed targets or combine with the ICMP and speed test target filters to view all managed targets |
| Type | equals | Cloud Agent, Mobile Agent, Static Agent (multi-select) |  | Filtering by agent is useful for viewing network segments that require a unique agent type such as: - Public Cloud environments that use cloud agents - Remote Worker PCs that rely on mobile agents |
4. Pagination - Tables support up to 100 rows per page
5. Table export and customization
6. Agent Record - Individual activation tokens are visible in the pending agents table. Hover to view and copy. Shared tokens are never shown in the application
7. Agent selector and bulk editing on active and pending agent tables
| Column | Value |
|---|---|
| Checkbox for selecting agents for bulk editing | |
| Name | Agent display name Click the name to view agent details After landing on the agent’s page, visit the Agent Page Metrics are not available for Pending Agents |
| Group | Name of the group assigned to the agent |
| Tags | Tags assigned to the agent |
| Type | Cloud agent, mobile agent, static agent |
| Activation Method | Activation method for the agent Different activation methods are supported by agent type: - Static Agents support shared token, individual token, and serial number activation - Cloud and Mobile Agents support Shared Token and Individual Token activation Learn more about agent activation methods |
| Access Token | Individual activation tokens are visible in the pending agent’s table. - Hover to view and copy. - To ensure security, shared tokens are never shown in the application. |
| Address | The primary or fallback address entered in the agent record. The nearest address appears when latitude and longitude are entered in the agent record. |
| Actions | ellipsis icon to open the actions menu Edit opens the editing modal Delete opens the confirm deletion modal |
Agent groups provide the highest level of association between agents.
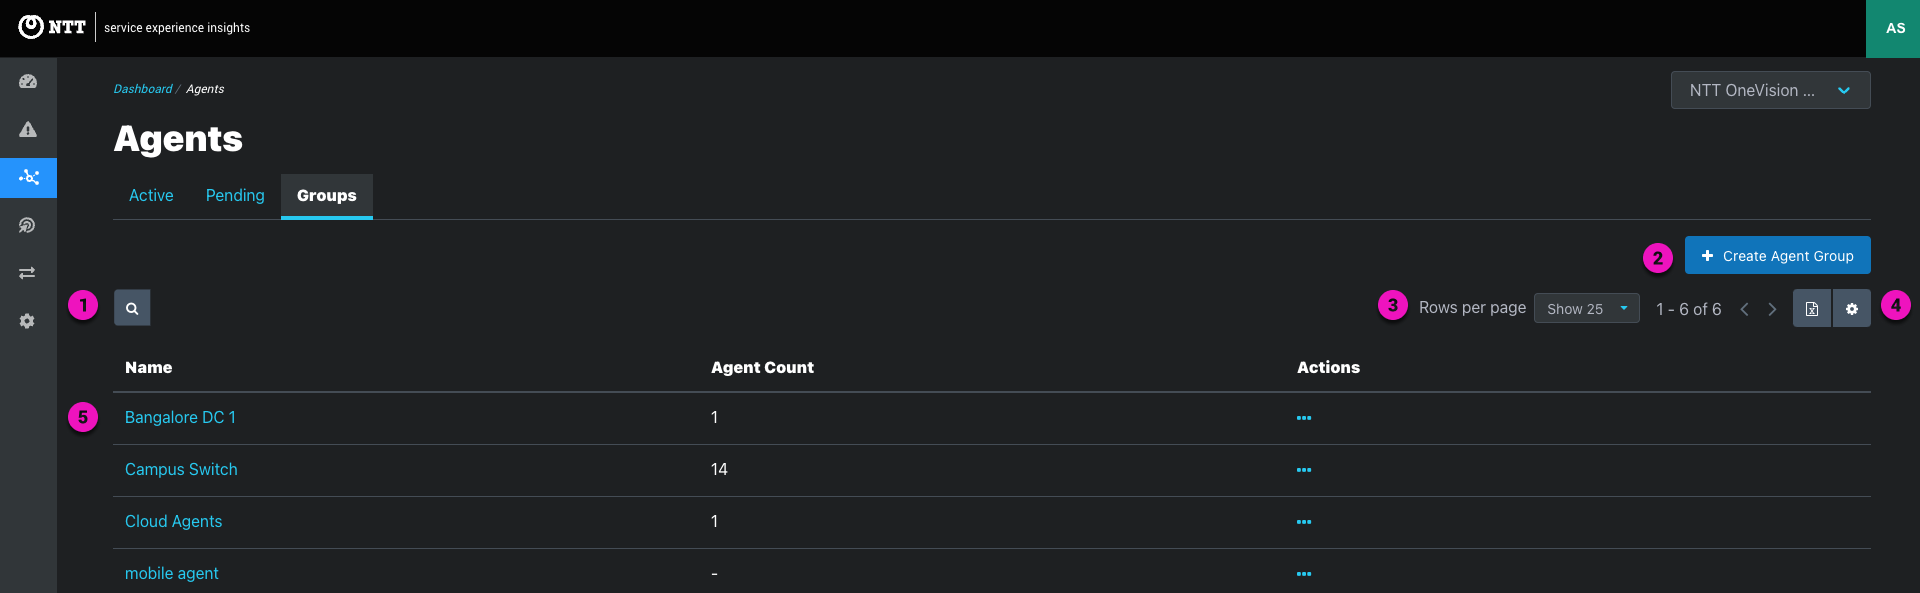
1. Search and filters
2. Create Agent Group button
3. Pagination - Tables support up to 100 rows per page
4. Table export and customization
5. Group Record - Individual activation tokens are visible in the pending agent’s table. Hover to view and copy. Shared tokens are never shown in the application.
| Column | Value |
|---|---|
| Name | Group display name Click the name to view the active list sorted by the agents assigned to the group |
| Agent Count | count of agents assigned to the group |
| Actions | ellipsis icon to open the actions menu - Edit opens the editing modal - Delete opens the confirm deletion modal |
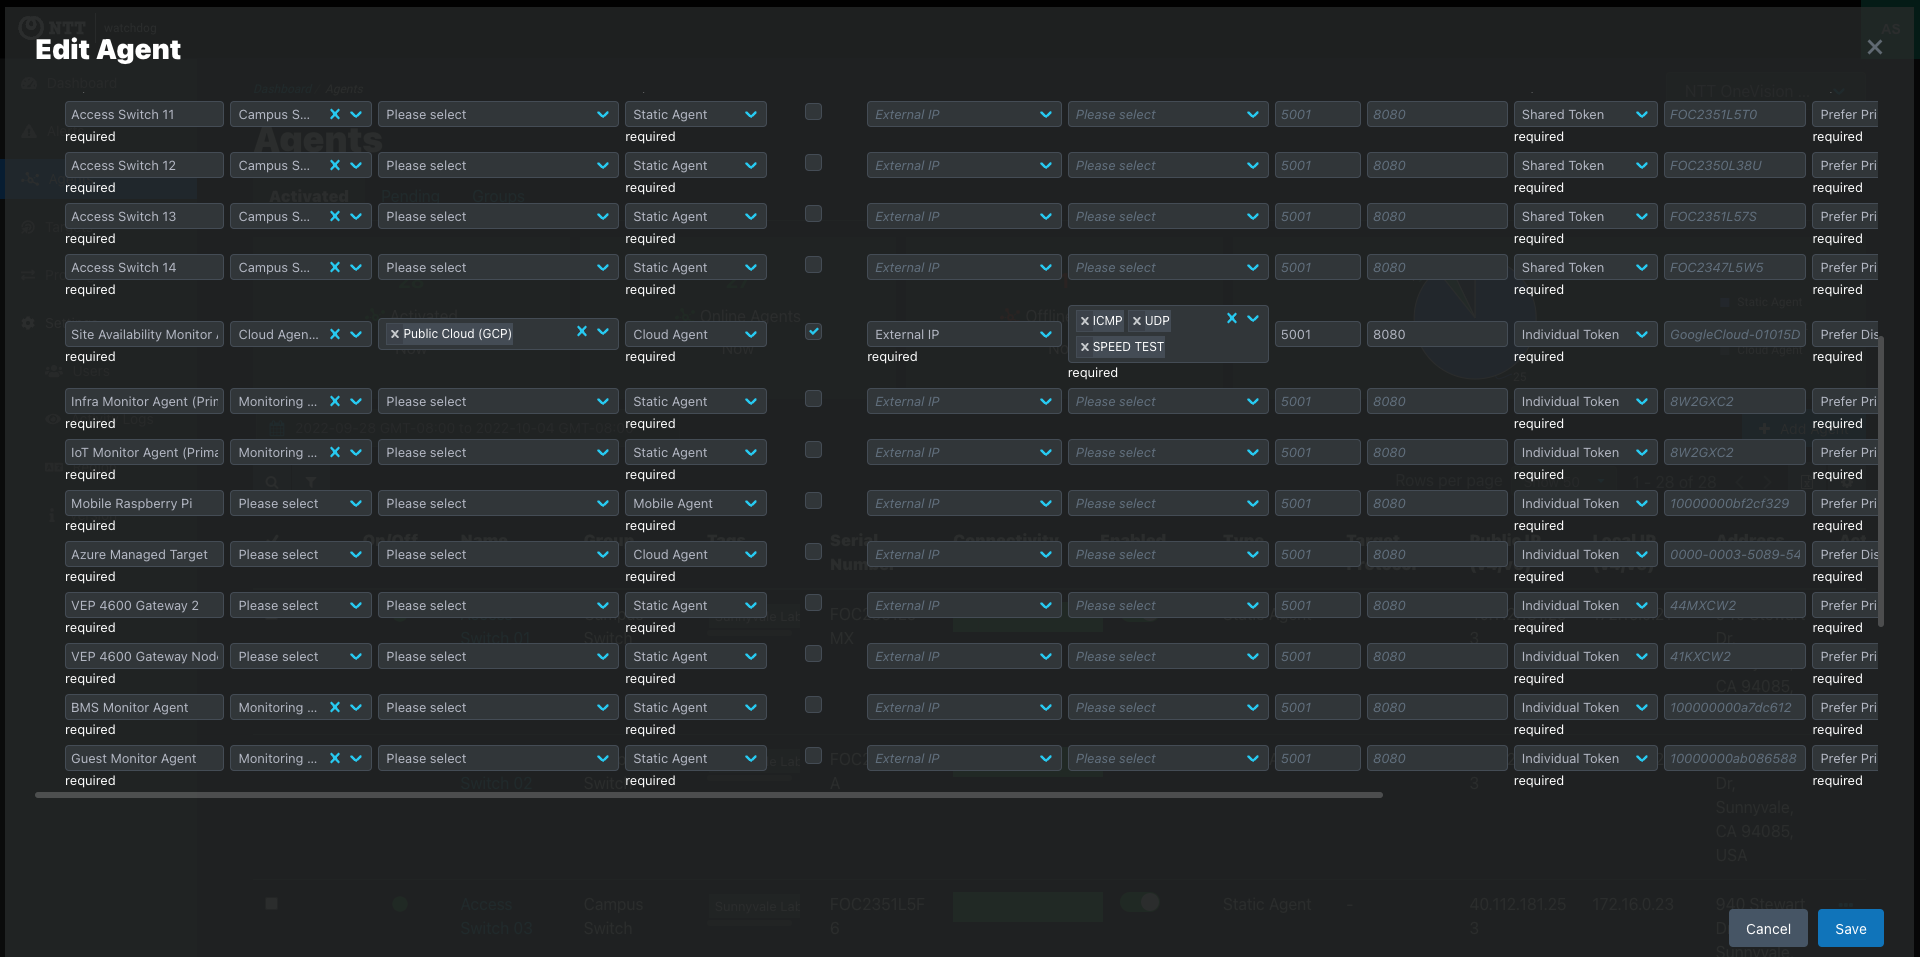
Create Static, Mobile, and Cloud Agents and enable target functionality as needed
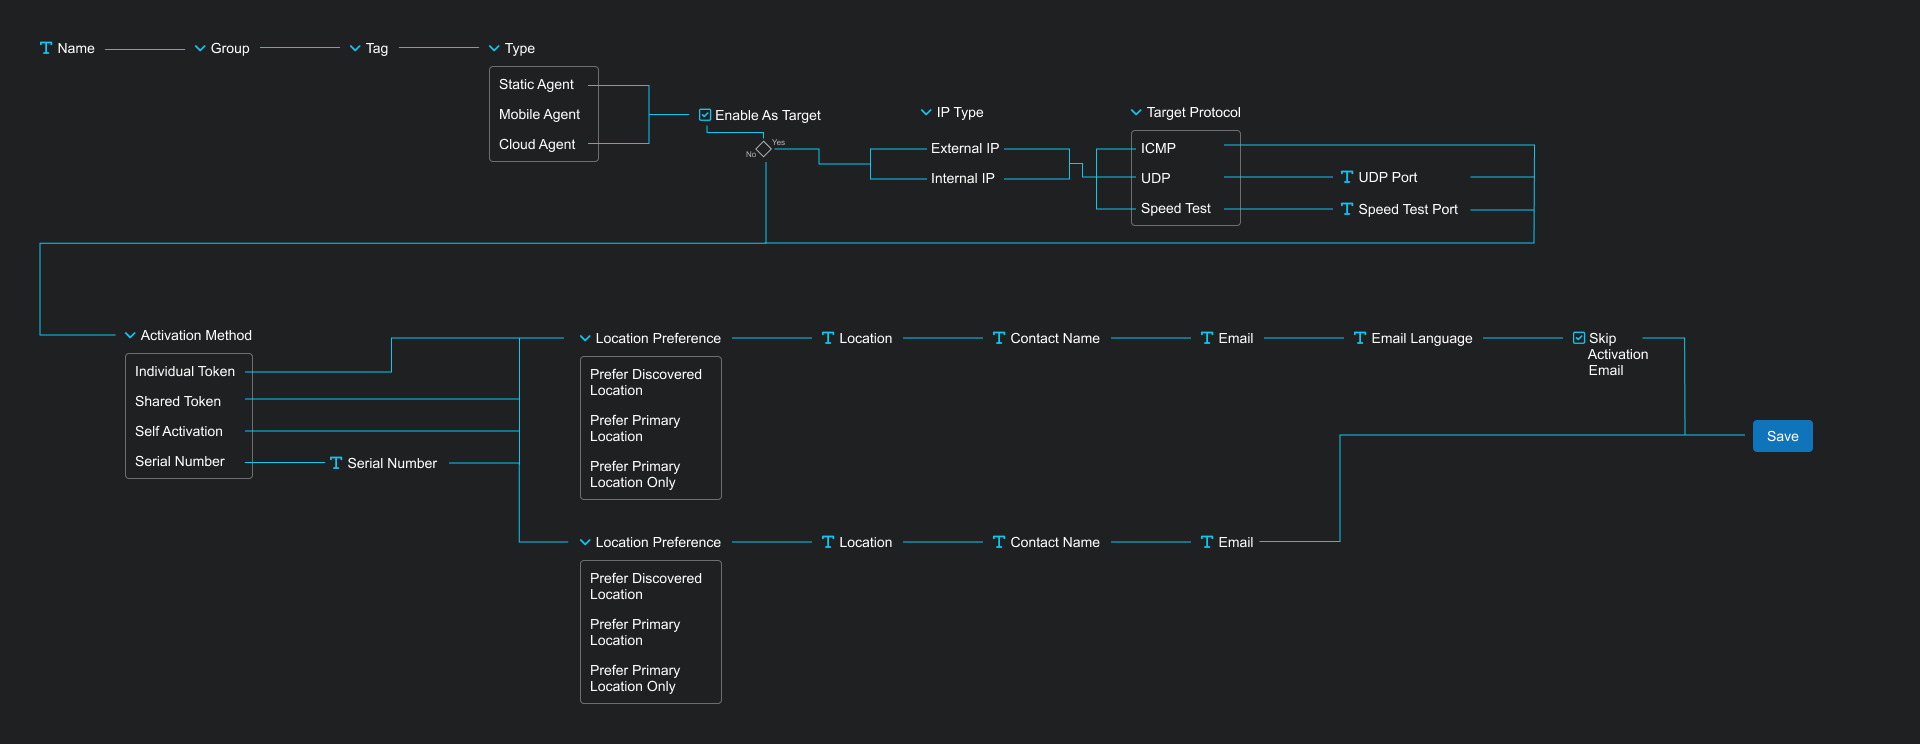
Agent Configuration Inputs:
| Agent Type | Supported Activation Method |
|---|---|
| Static Agent | - Individual token - Shared token - Serial number |
| Mobile Agent | - Individual token - Shared token |
| Cloud Agent | - Individual token - Shared token |
1. Shared Token
2. Individual Token
3. Serial number
Edit or delete one or more agents using the following methods:
1. Agent selector and bulk editing on active and pending agent tables
2. Actions ellipsis on active and pending agent table rows
3. Agent page
The agent editing modal shows the complete agent configuration for the selected agents
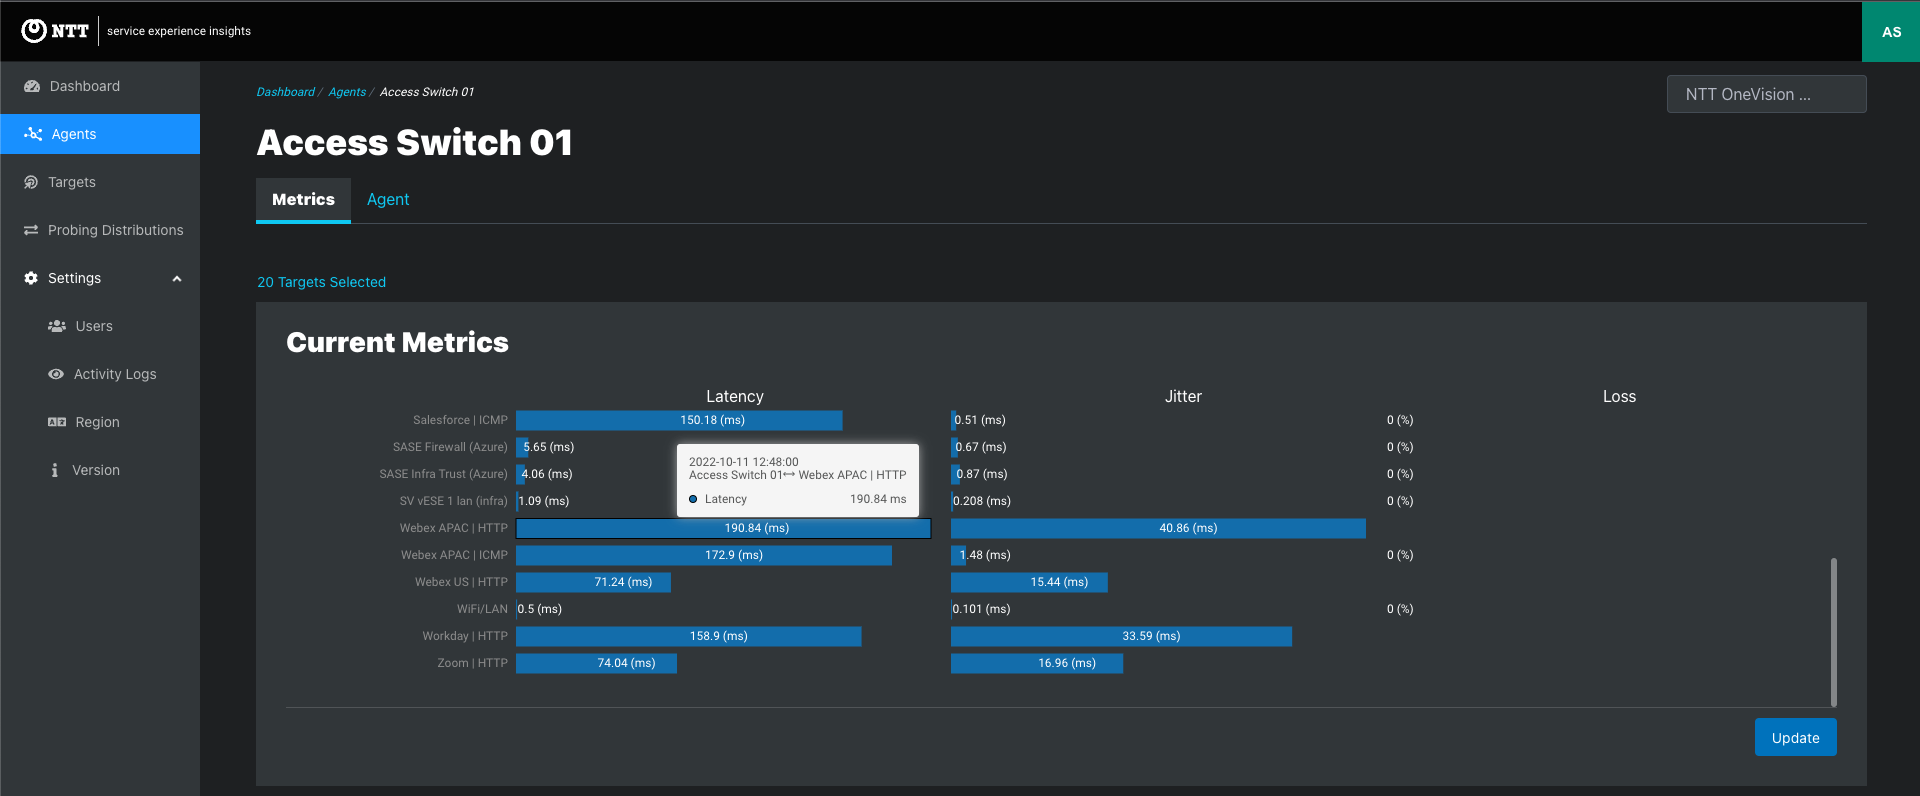
Each agent has a dedicated page providing data visualization and information about the agent. Reach the agent page by:
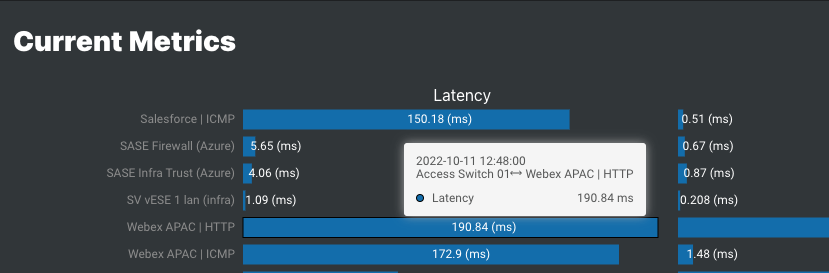
The metrics tab shows all available metrics for the agent. Metrics reflect three types of data:
Following is a quick reference to the metrics provide by agent type. See the Metrics article for details about each type of metric.
Time Series Data
| Time Range | Default Alignment Period | Shortest Alignment Period |
|---|---|---|
| 1 minute to 4 hours | Auto (1 minute) | 1 minute |
| 4 to 12 hours | Auto (3 minutes) | 1 minute |
| 12 to 20 hours | Auto (15 minutes) | 1 minute |
| 20 hours to 2.5 days | Auto (30 minutes) | 1 minute |
| 2.5 to 9 days | Auto (1 hour) | 1 minute |
| 9 to 28 days | Auto (3 hours) | 3 minutes |
| 28 to 42 days | Auto (6 hours) | 5 minutes |
| 42 to 62 days | Auto (6 hours) | 15 minutes |
| 62 to 92 days | Auto (6 hours) | 30 minutes |
| 92 to 184 days | Auto (6 hours) | 1 hour |
| 184 to 366 days | Auto (6 hours) | 3 hours |
| ≥366 days | Auto (6 hours) | 6 hours |
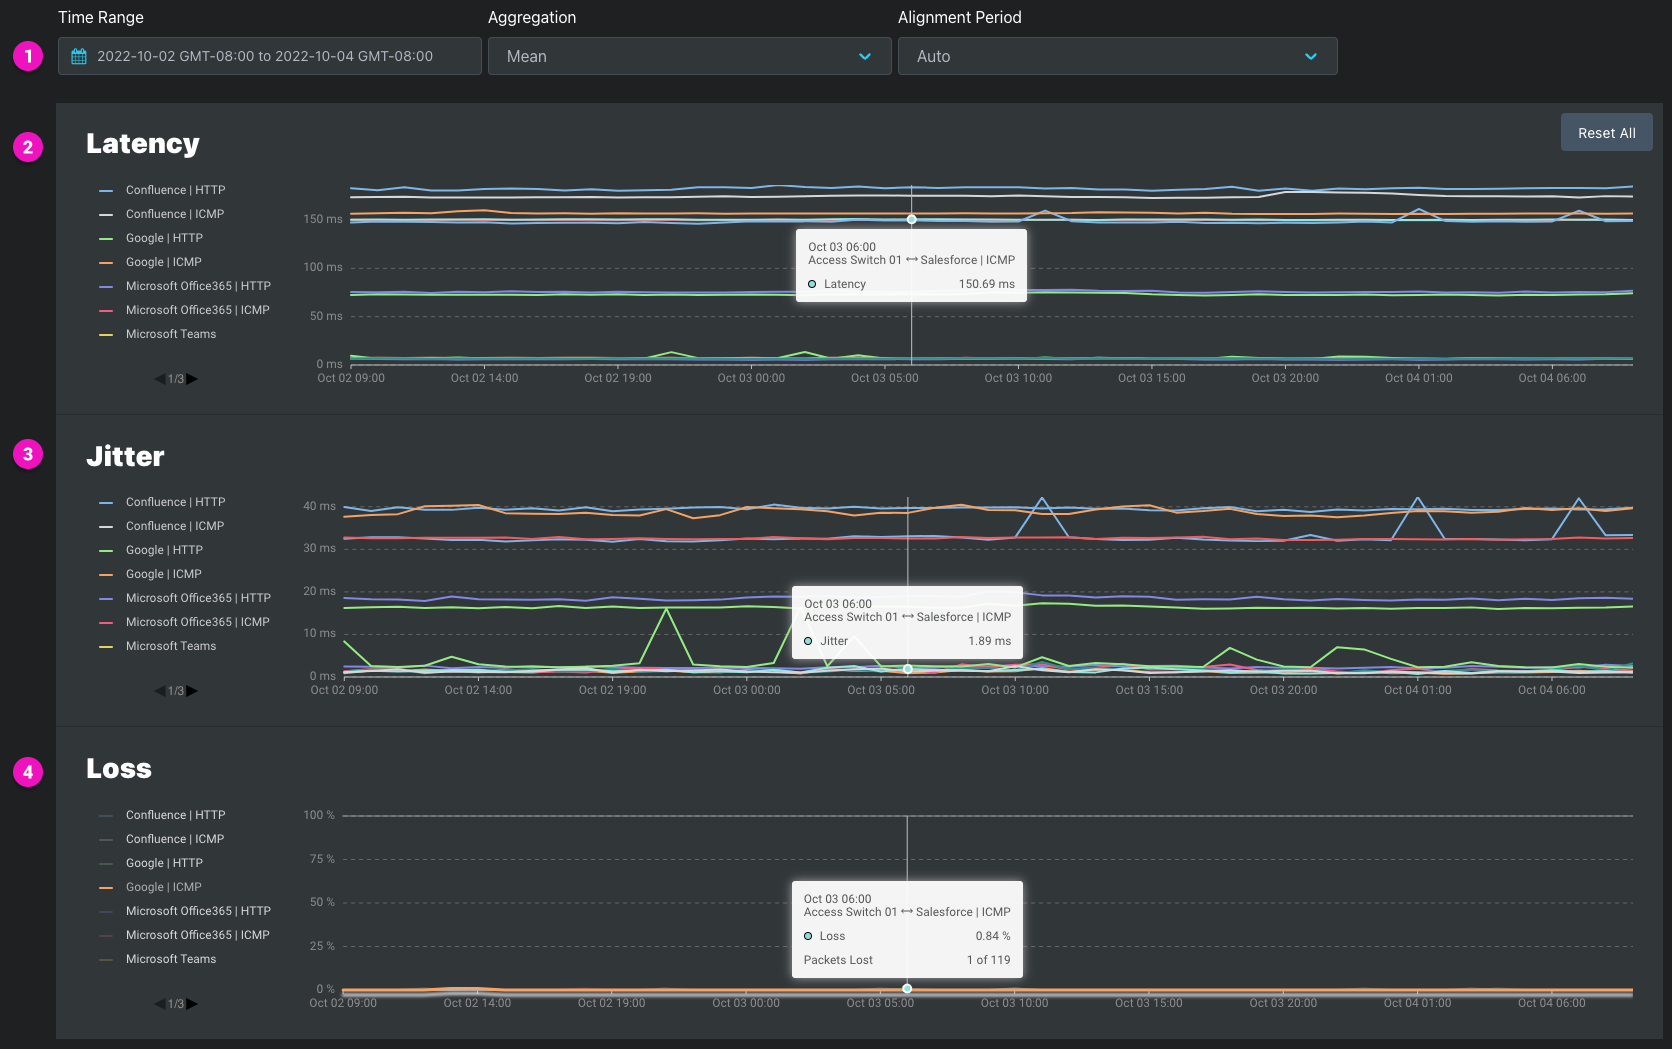
1. Latency
2. Jitter
3. Loss
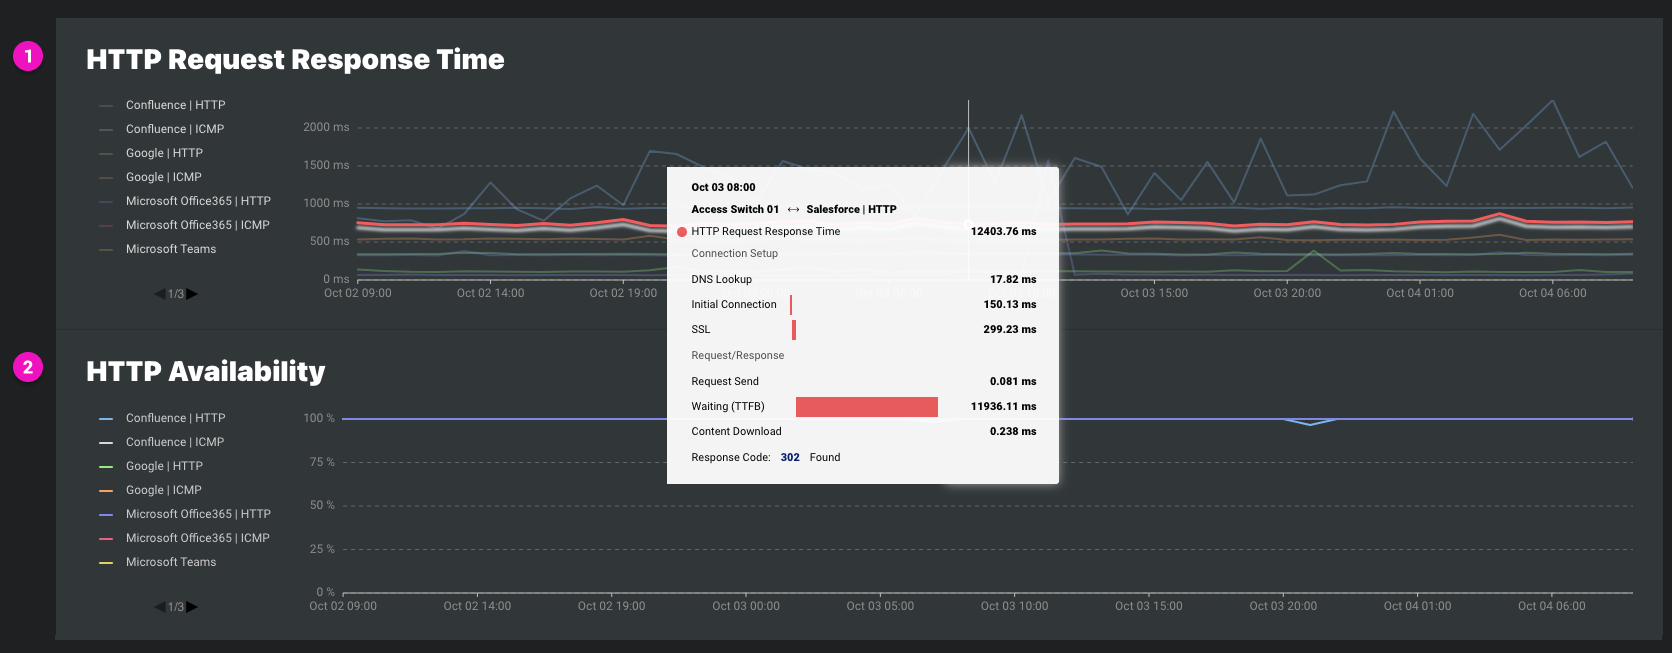
1. HTTP Request Response Time
2. HTTP Availability
The Connectivity graphic shows agent connectivity for the date range selected


1. On-demand speed test 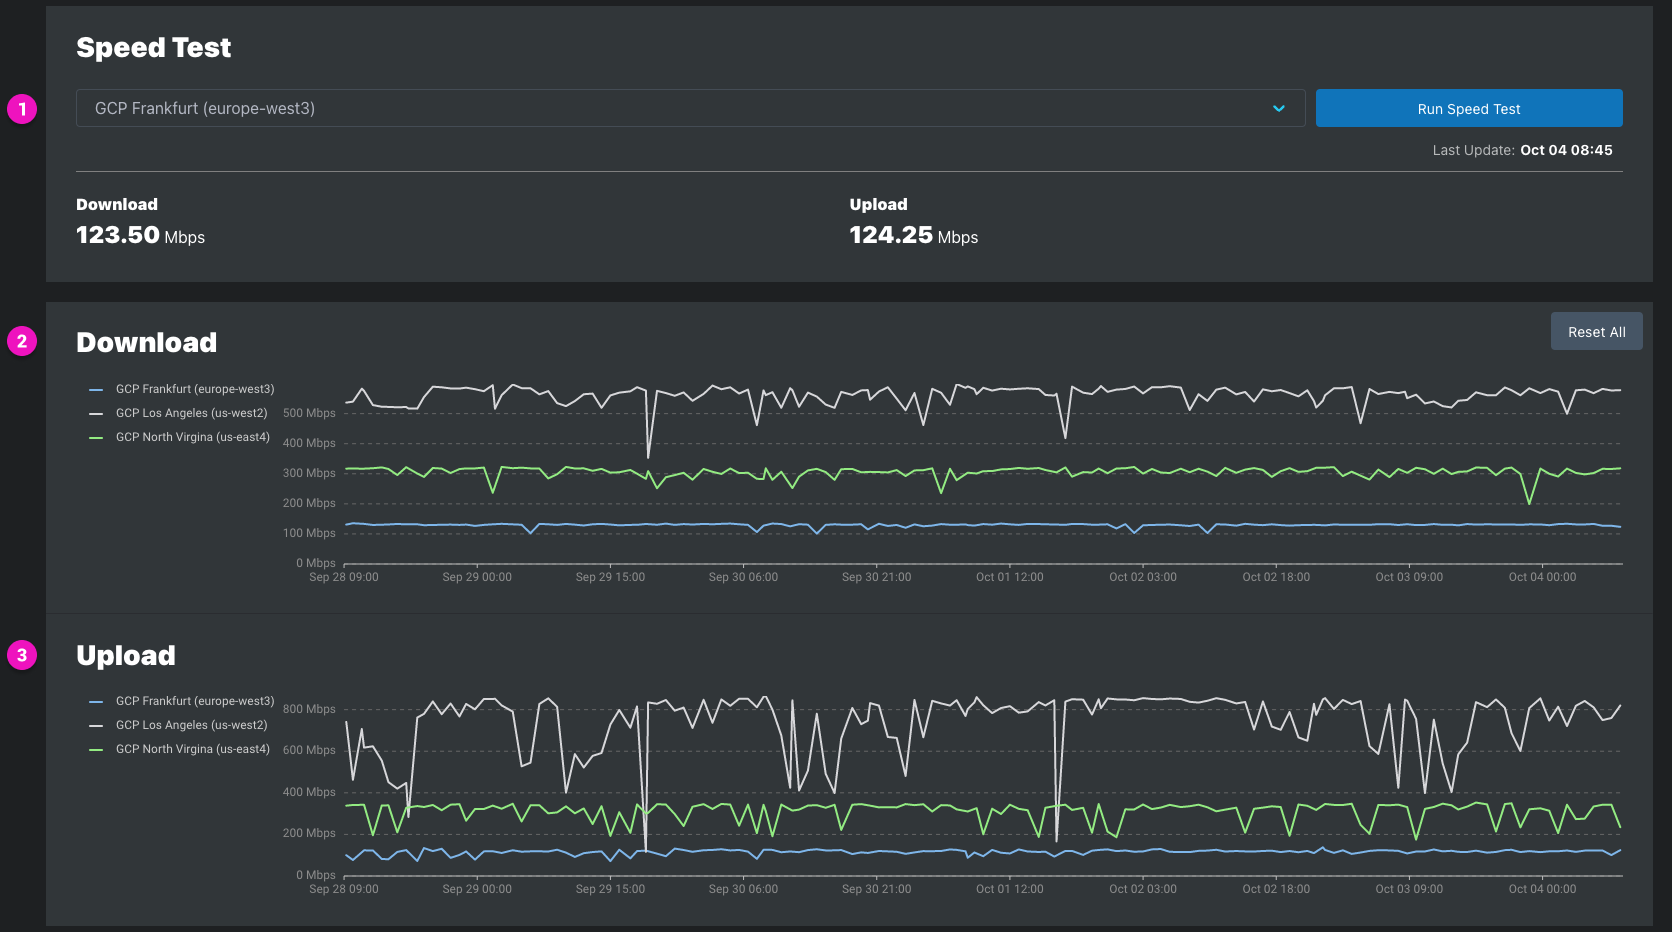
1a. Results for the last speed test for the speed test shown in the dropdown
1b. Click the dropdown to show all speed test targets enabled for the agent
1c. Select the speed test target and Click 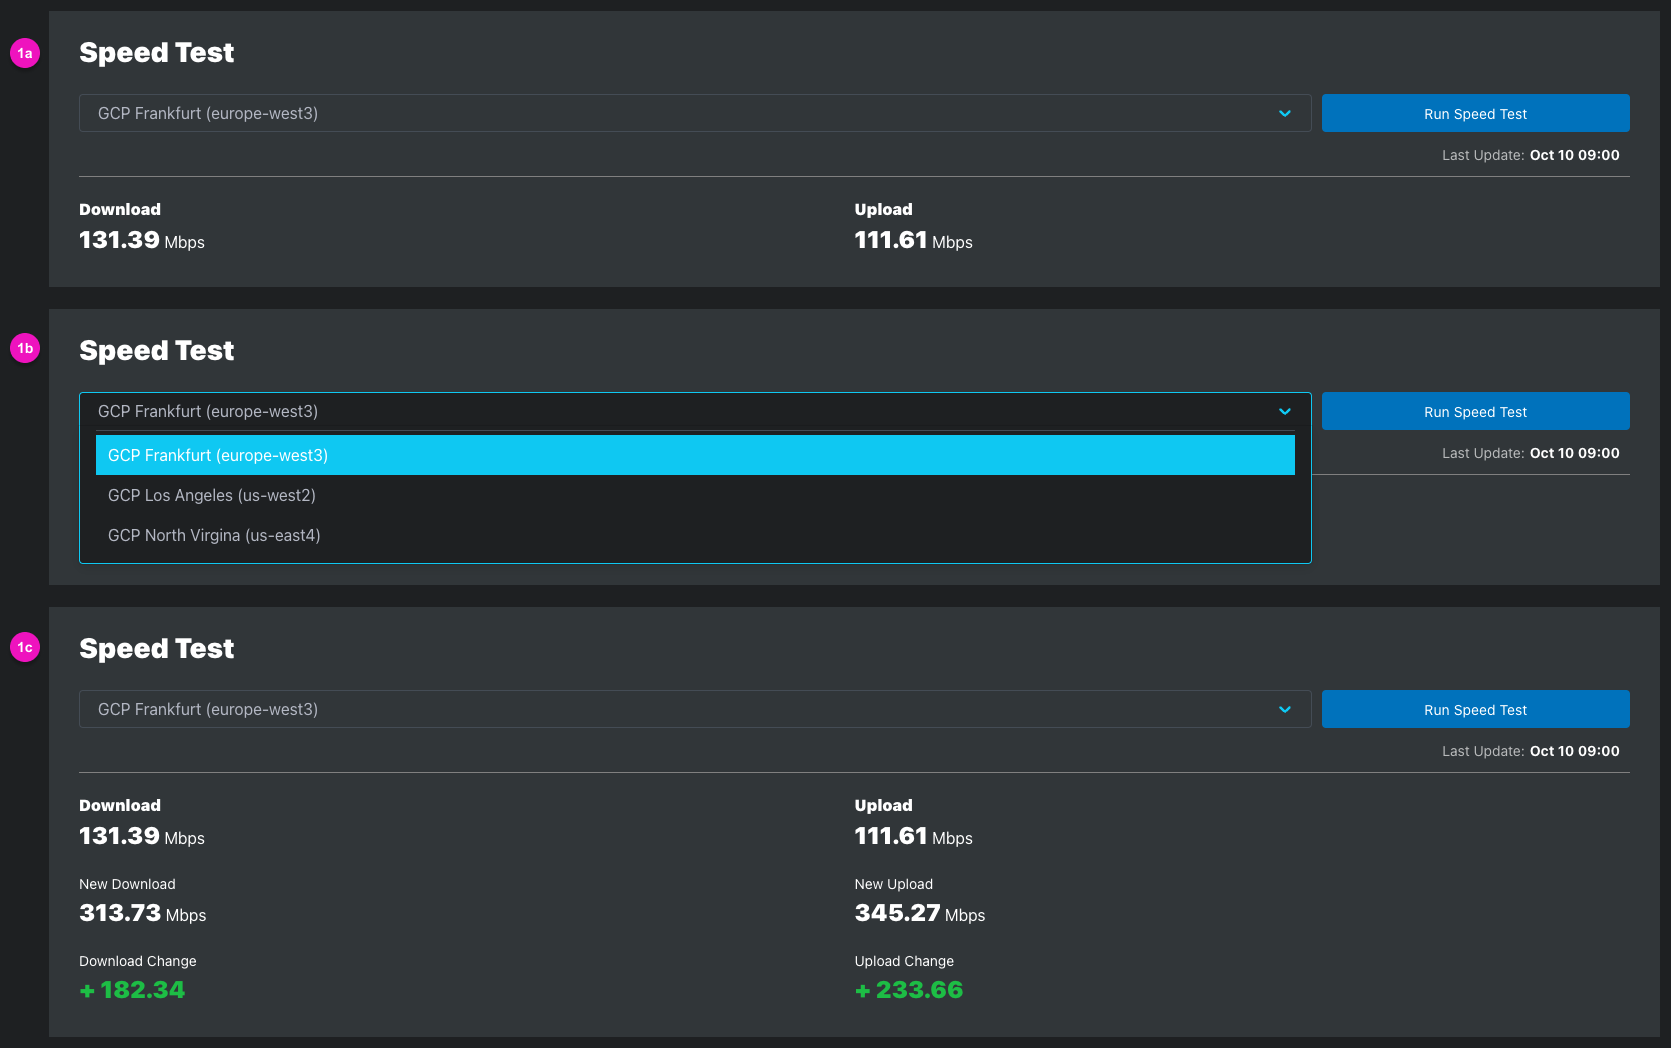
2-3. Download and Upload Speed
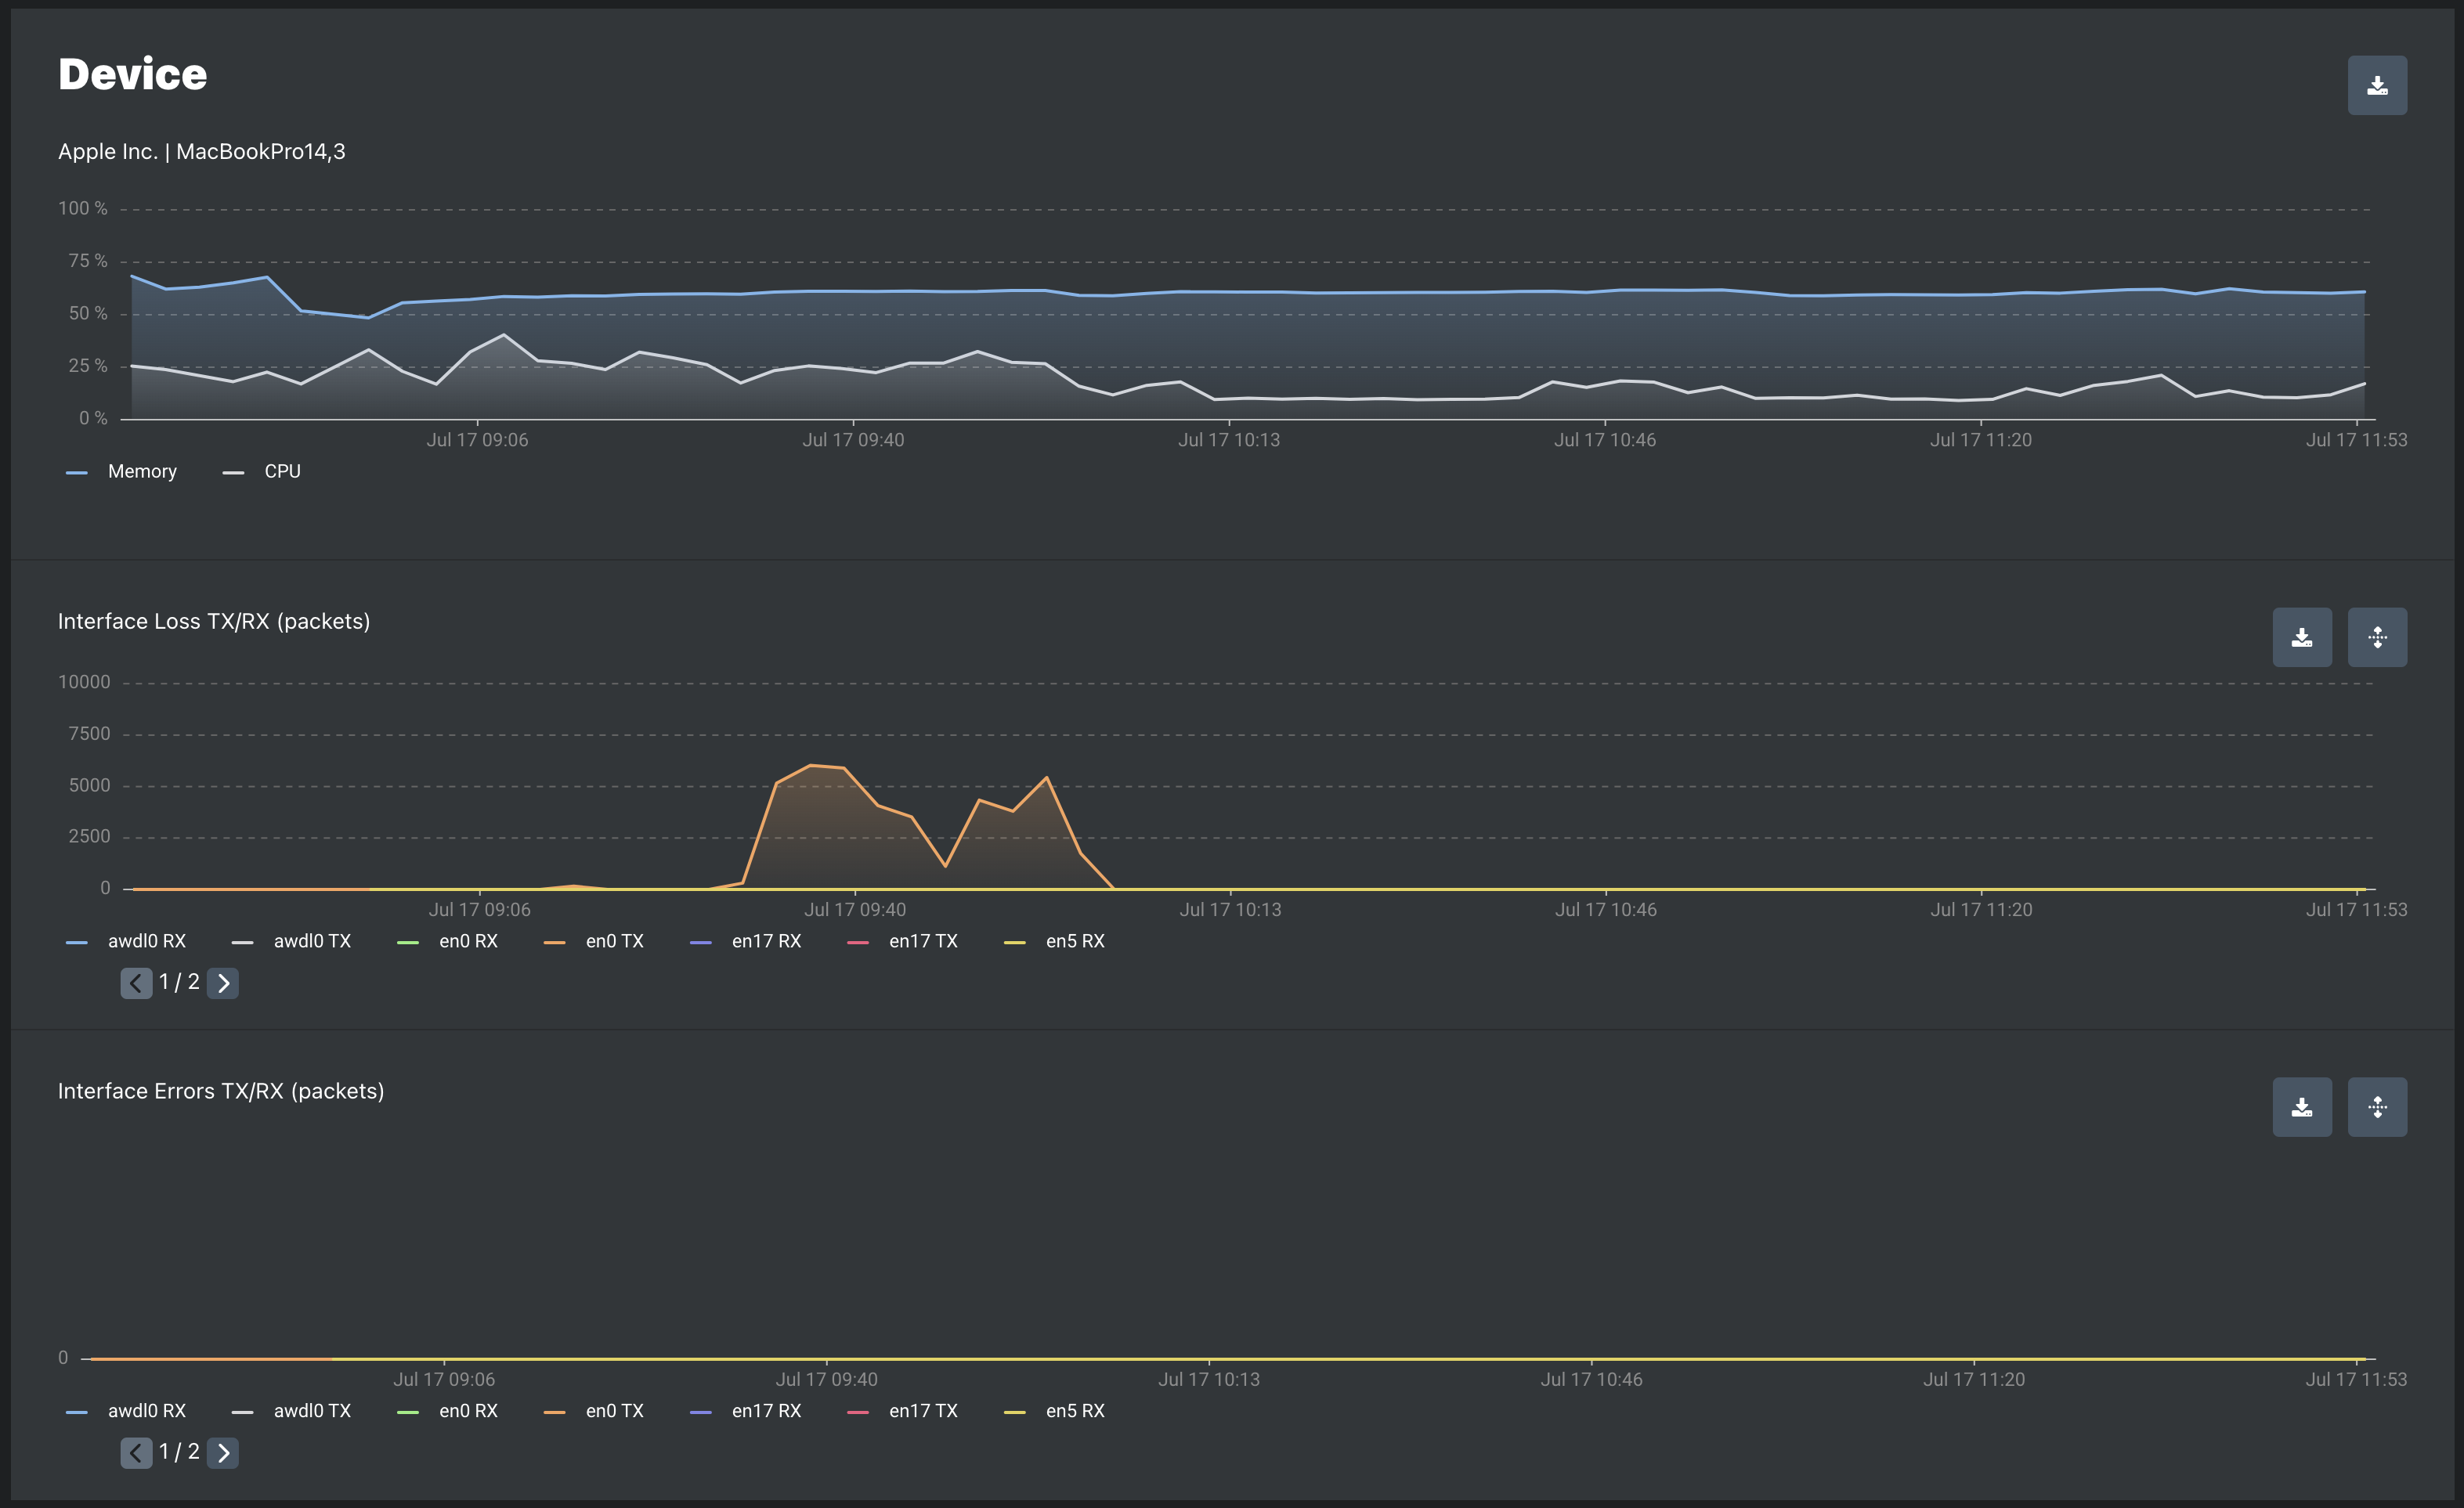
| Metric | Description |
|---|---|
| Interface Loss TX | The number of outbound packets which were discarded even though no errors had been detected to prevent their being transmitted. One possible reason for discarding such a packet could be to free up buffer space. |
| Interface Loss RX | The number of inbound packets which were discarded even though no errors had been detected to prevent their being deliverable to a higher-layer protocol. One possible reason for discarding such a packet could be to free up buffer space. |
| Interface Errors TX | The number of incoming packets that were discarded because of errors. Examples of possible scenarios that cause this could be a duplex mismatch, CRC mismatch etc. |
| Interface Errors RX | The number of outgoing packets that were discarded because of errors. One possible scenario that causes this could be a duplex mismatch. |
See On-demand Troubleshooting article for details about this feature.’
View summary information, location, and connectivity for each agent
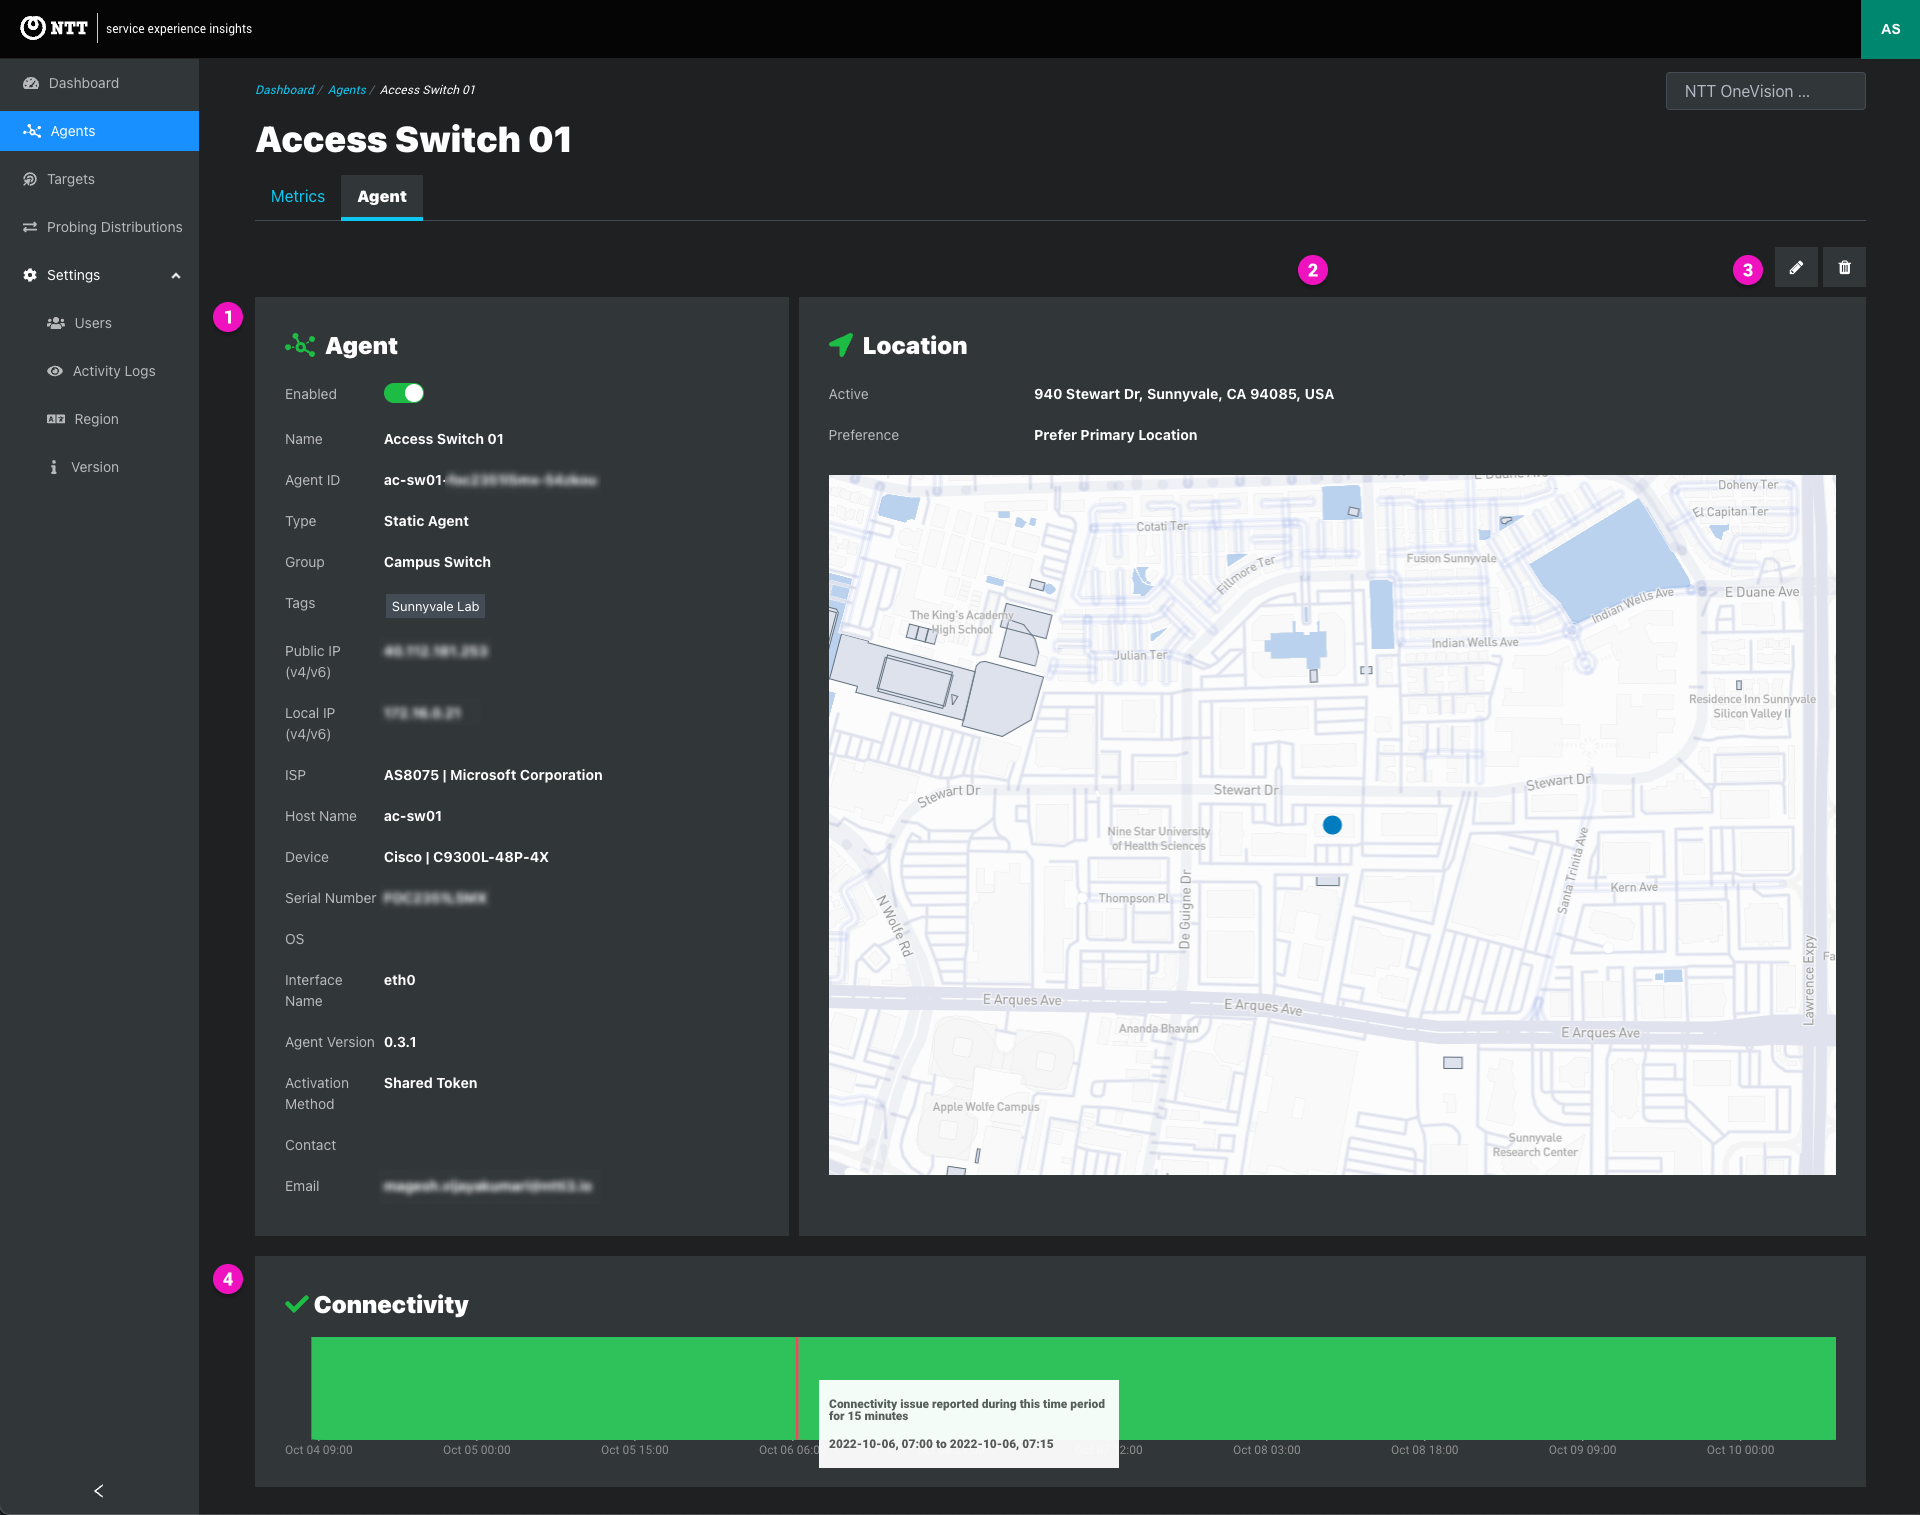
1. Agent details
| Attribute | Usage note |
|---|---|
| Agent | Online agent, Offline agent |
| Enabled | Agent Enabled, Agent Disabled |
| Name | Agent display name |
| Agent ID | - Agent ID is the agent’s unique identifier - Lowercase and hyphenated agent name appended with a unique six-digit alphanumeric string in this format: “vlan-infra-monitor-agent-rtph29” |
| type | Type of agent: Static agent, mobile agent, cloud agent |
| Group | Agent group assigned to the agent |
| Tags | Agent tags assigned to the agent |
| Public IPv4/IPv6 | Last public IPv4 address \ last public IPv6 reported by the agent |
| Local IPv4/IPv6 | Last local IPv4 address \ last local IPv6 reported by the agent |
| Proxy HTTP(S) | Agents automatically use the network proxy configured in the operating system when available. If proxy is configured for the agent, the HTTP/HTTPS IP addresses are displayed |
| Proxy Bypass | Proxy Bypass IP address is shown when configured for the agent. Static Agents only. Mobile Agents do not support Proxy blocking |
| ISP | - Last ASN | last ISP reported by the agent - “AS3320 | Deutsche Telekom AG”, “AS4713 | NTT Communications Corporation”, etc. |
| MNO (MCC/MNC) | Mobile Network Operator (MNO), Mobile Country Code (MCC), and Mobile Network Code (NNC) are displayed - “Verizon | (310/004)” |
| Host name | Host device name returned by the agent |
| Device | - Host device make | host device model - “Cisco | 9300L-48P-4x”, “Apple Inc. | MacBookPro14,3”, etc. |
| Serial Number | Host serial number returned by agent |
| OS | - Host OS returned by agent - “Window” or “macOS” for mobile agents - “EdgeLQ OS” for cloud agents and static agents running on dedicated hardware. EdgeLQ is the proprietary Linux OS for the service, and “0.3.8” is the OS version number” -No OS is listed for agents running as Docker containers on application hosting devices like the Cisco Catalyst 9k Series of routers and switches |
| Interface Name | Host interface name used by the installed agent |
| Agent Version | gent software version number like “v3.0.1” |
| Activation Method | - Activation method configured for the agent - Shared Token, Individual Token, Serial Number |
| Activation Token | - Individual tokens are shown. can be copied or changed - See Activation methods |
| Contact | - Contact name added to the agent record - Unlike the contact’s email, their name is not required when adding new agents and maybe blank |
| - Contact email added to the agent record - An email is required to create agents |
2. Edit and delete
3. Location
4. Connectivity The Connectivity graphic shows agent connectivity for the date range selected