| Admin | Co-admin | Asset Manager | Viewer | ||
|---|---|---|---|---|---|
| Probing Distributions | View | ||||
| Add/Edit/Delete |
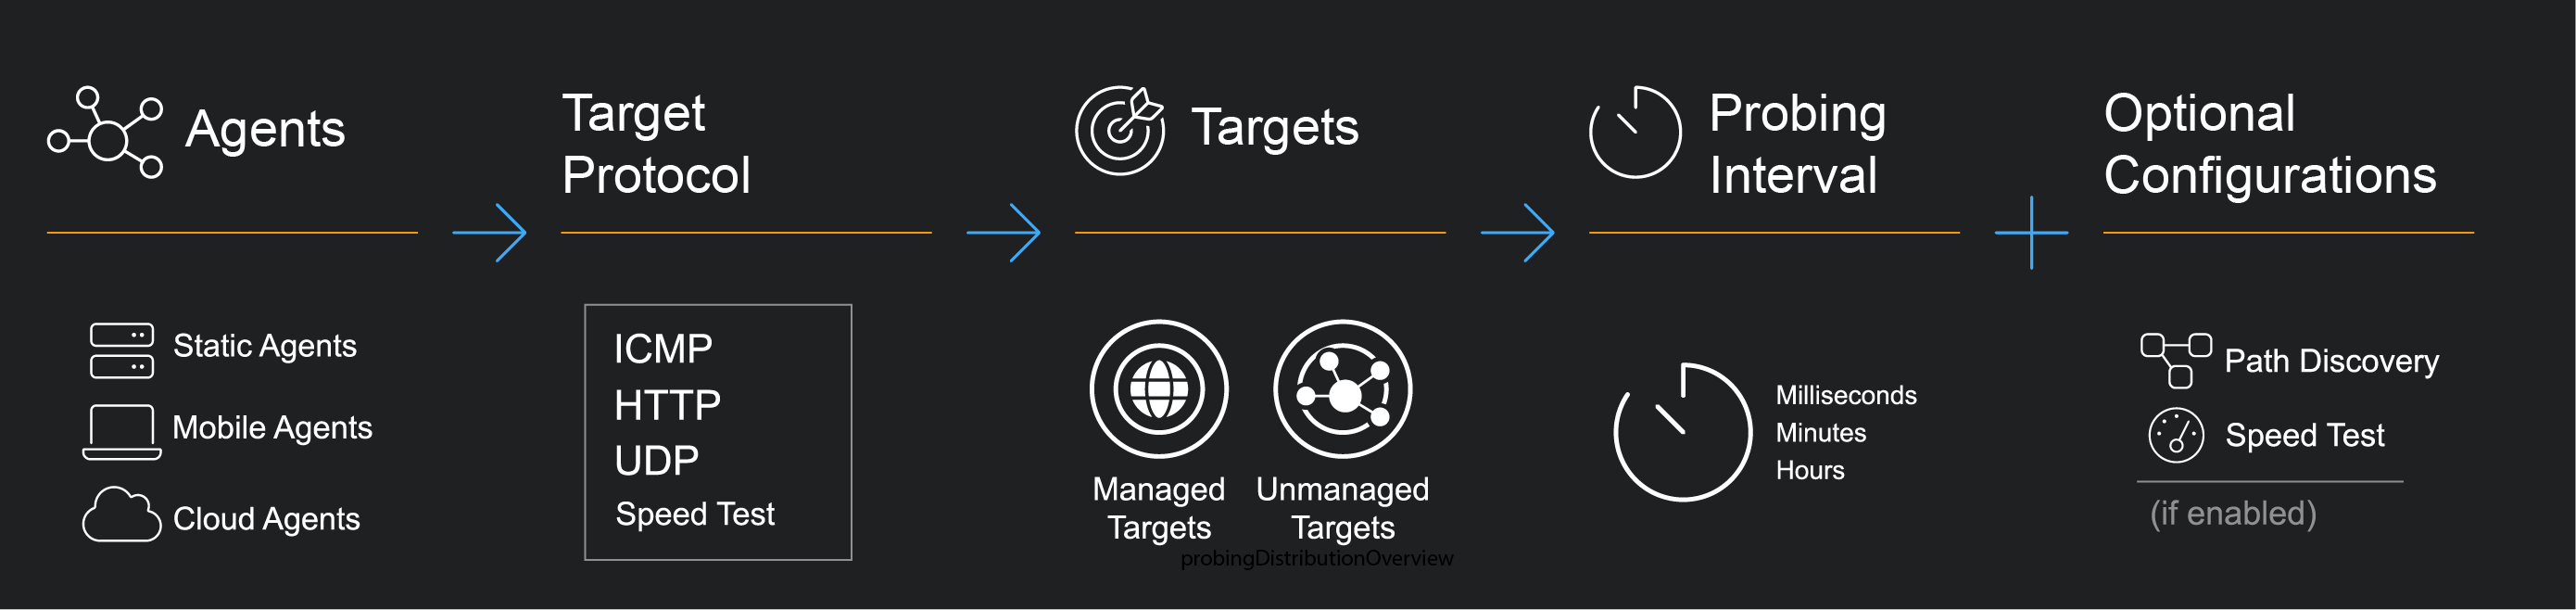
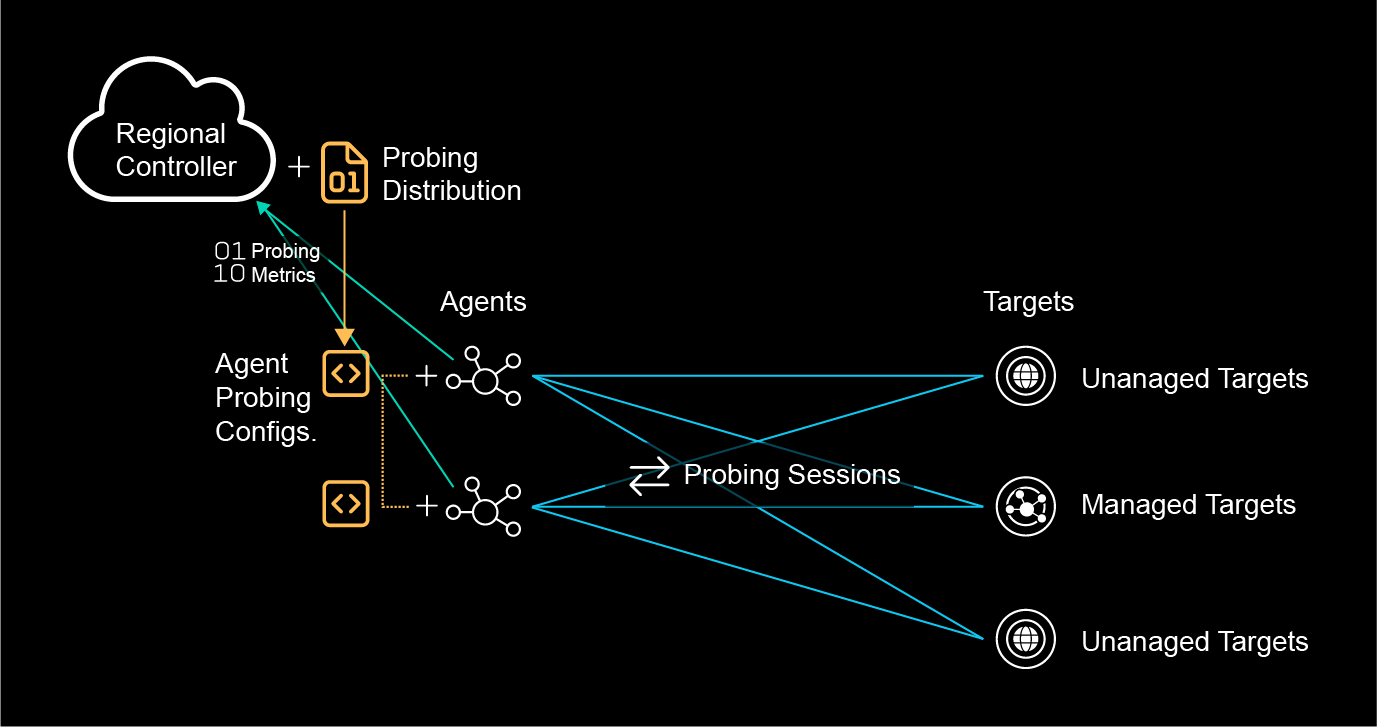
Probing Distributions are configurable policies for triggering synthetic monitoring traffic between agents and targets.
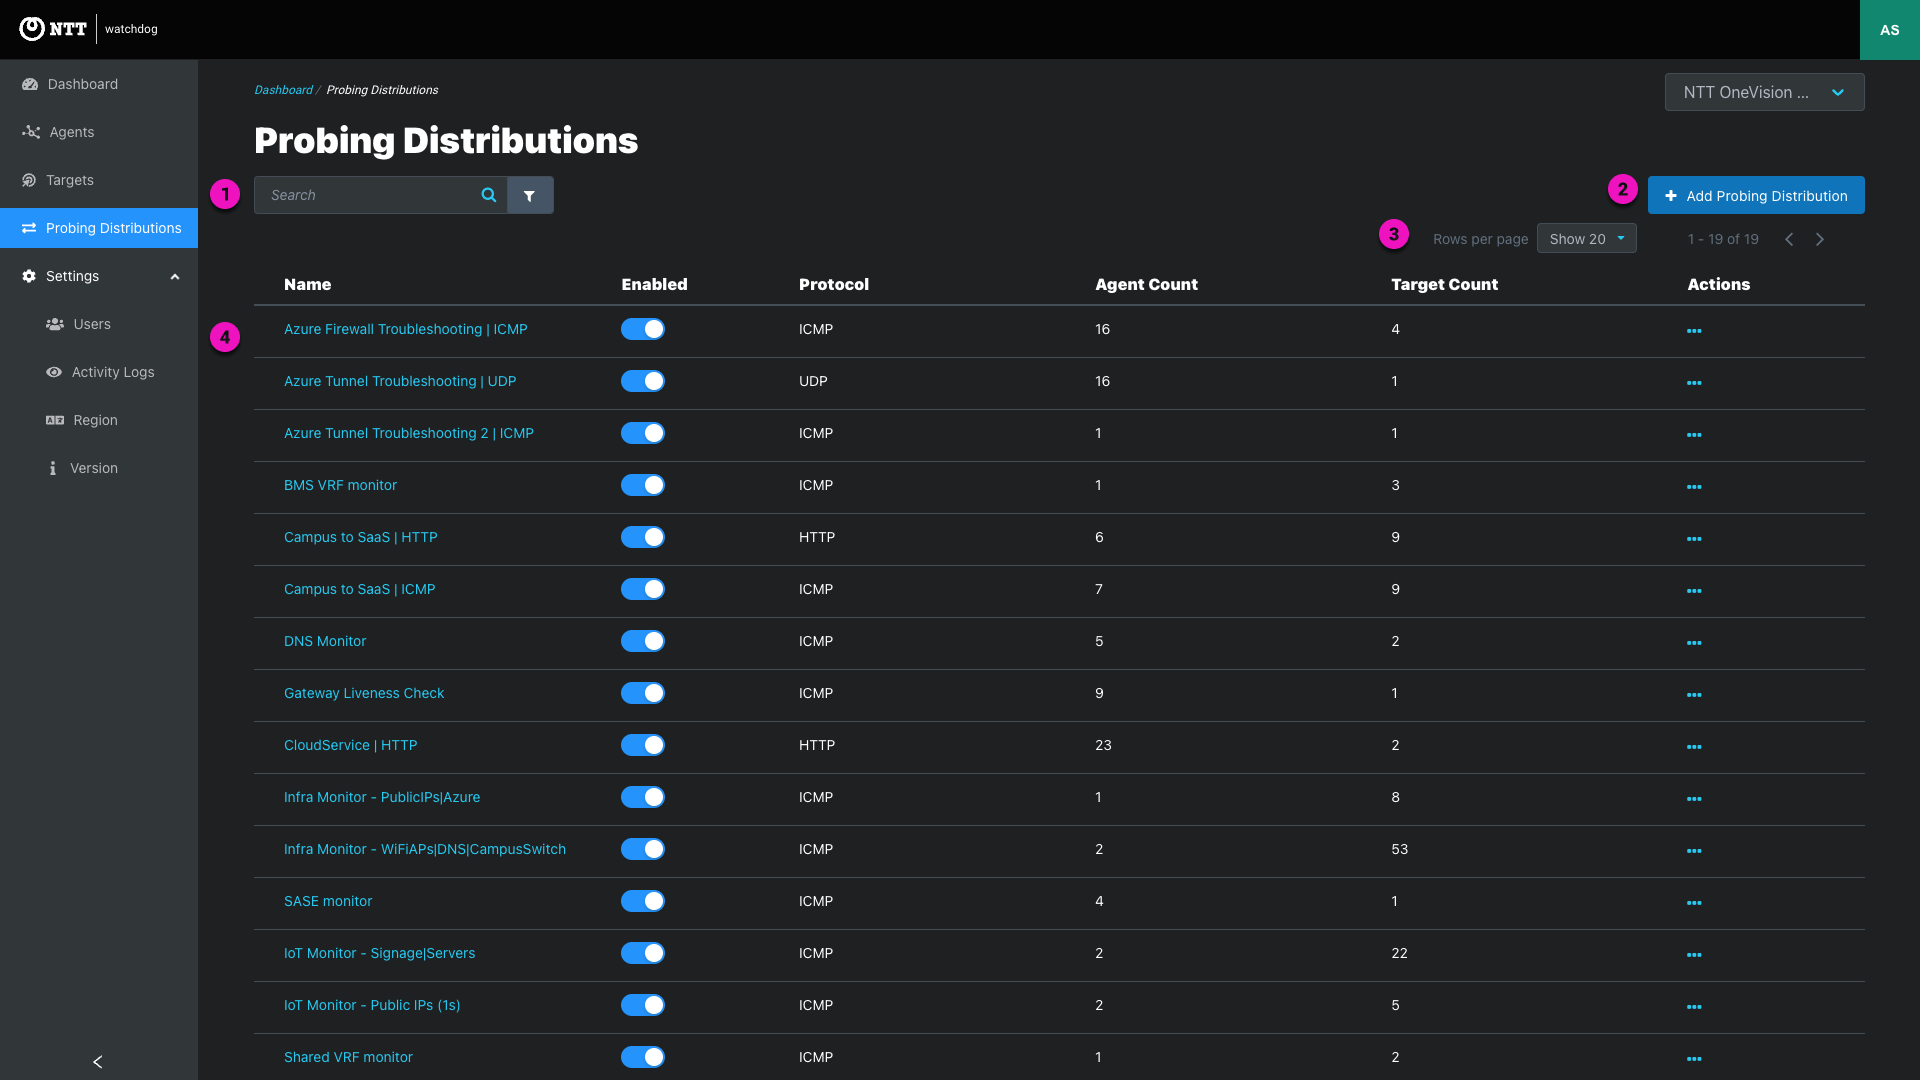
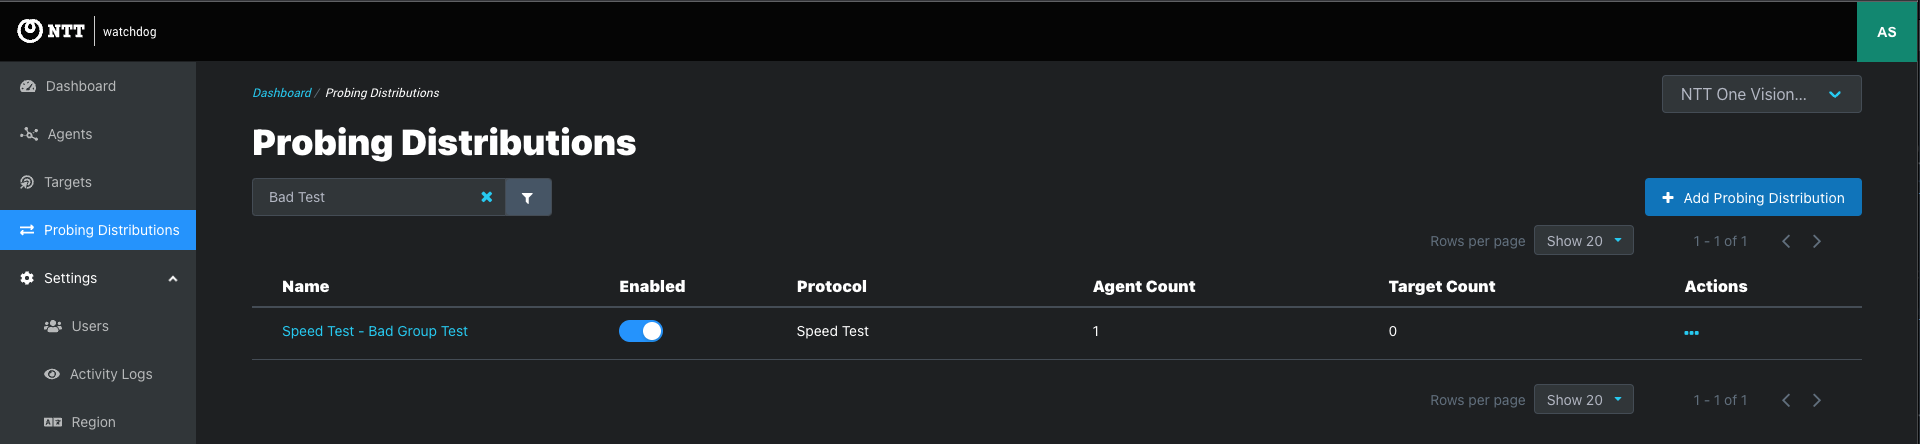
1. Search and filters
Search - Click the icon to search probing distributions by name.
Filters - Click the icon to use filters. Multiple filters create and statements.
| Filter Key | Operator | Filter options | Usage tip |
|---|---|---|---|
| Enabled | equals | True, False (single select) | Display Enabled or Disabled probing distributions |
| Name | equals | Text (exact match) | Use text search if the exact spelling of the name is unknown |
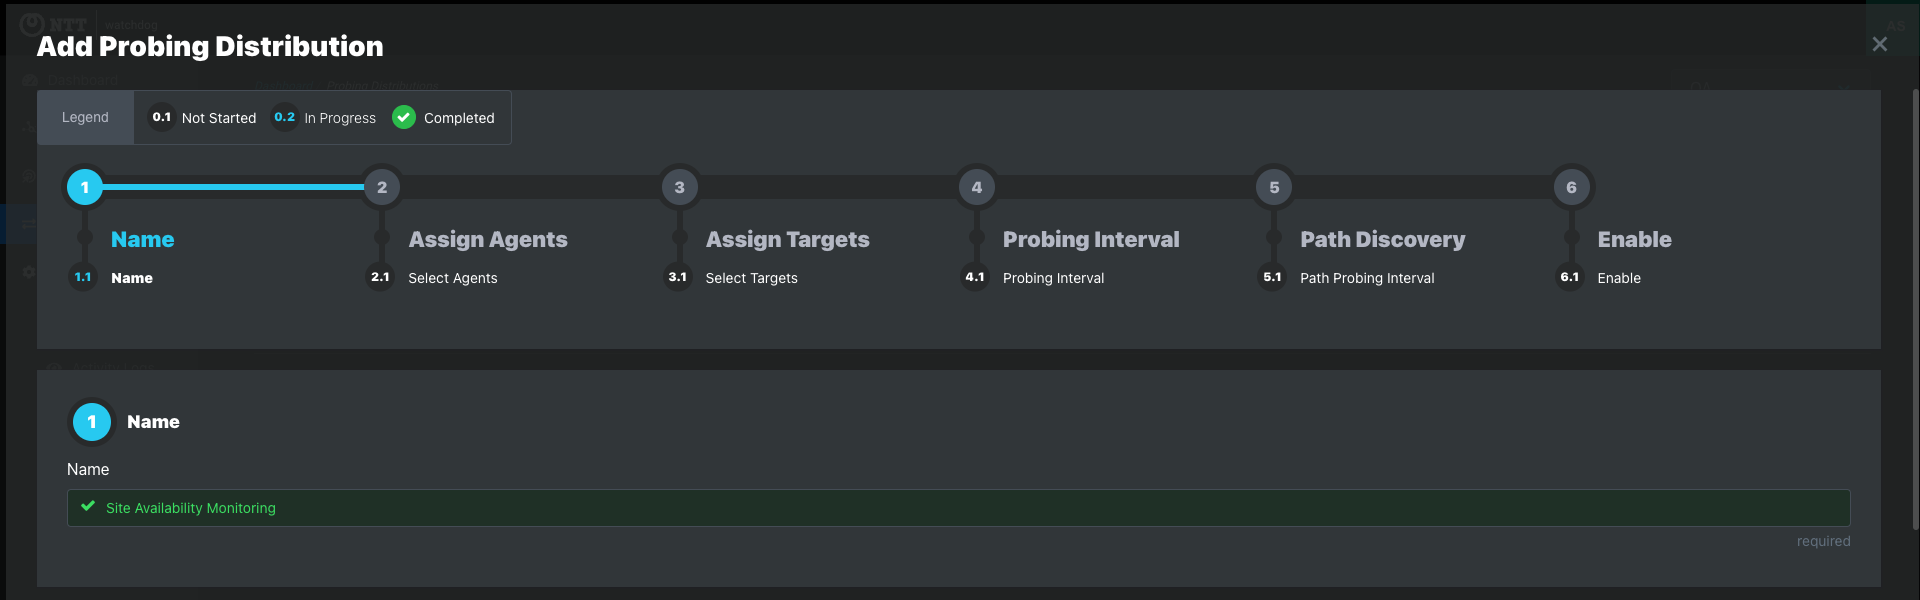
2. Add Probing Distributions button- Click to open the probing distribution creation modal. See Adding Probing Distributions.
3. Pagination

4. Table Sorting
5. Probing distributions table
| Column | Displayed Value |
| Name | - Probing Distribution display name - Links to the probing distribution page |
| Enabled | - Probing Distribution Enabled, or Disabled - Toggle to enabled or disabled a probing distribution - This action is also available on the probing distribution summary page and editing modal |
| Protocol | - Target protocol used by the probing distribution - Each probing distributions one target protocol - ICMP, HTTP, UDP, or Speed Test |
| Agent Count | Count of agents in the probing distribution |
| Target Count | Count of targets in the probing distribution |
| Actions | ellipsis icon to open the actions menu View links to the probing distribution summary page Edit opens the editing modal Delete opens the confirm deletion modal |
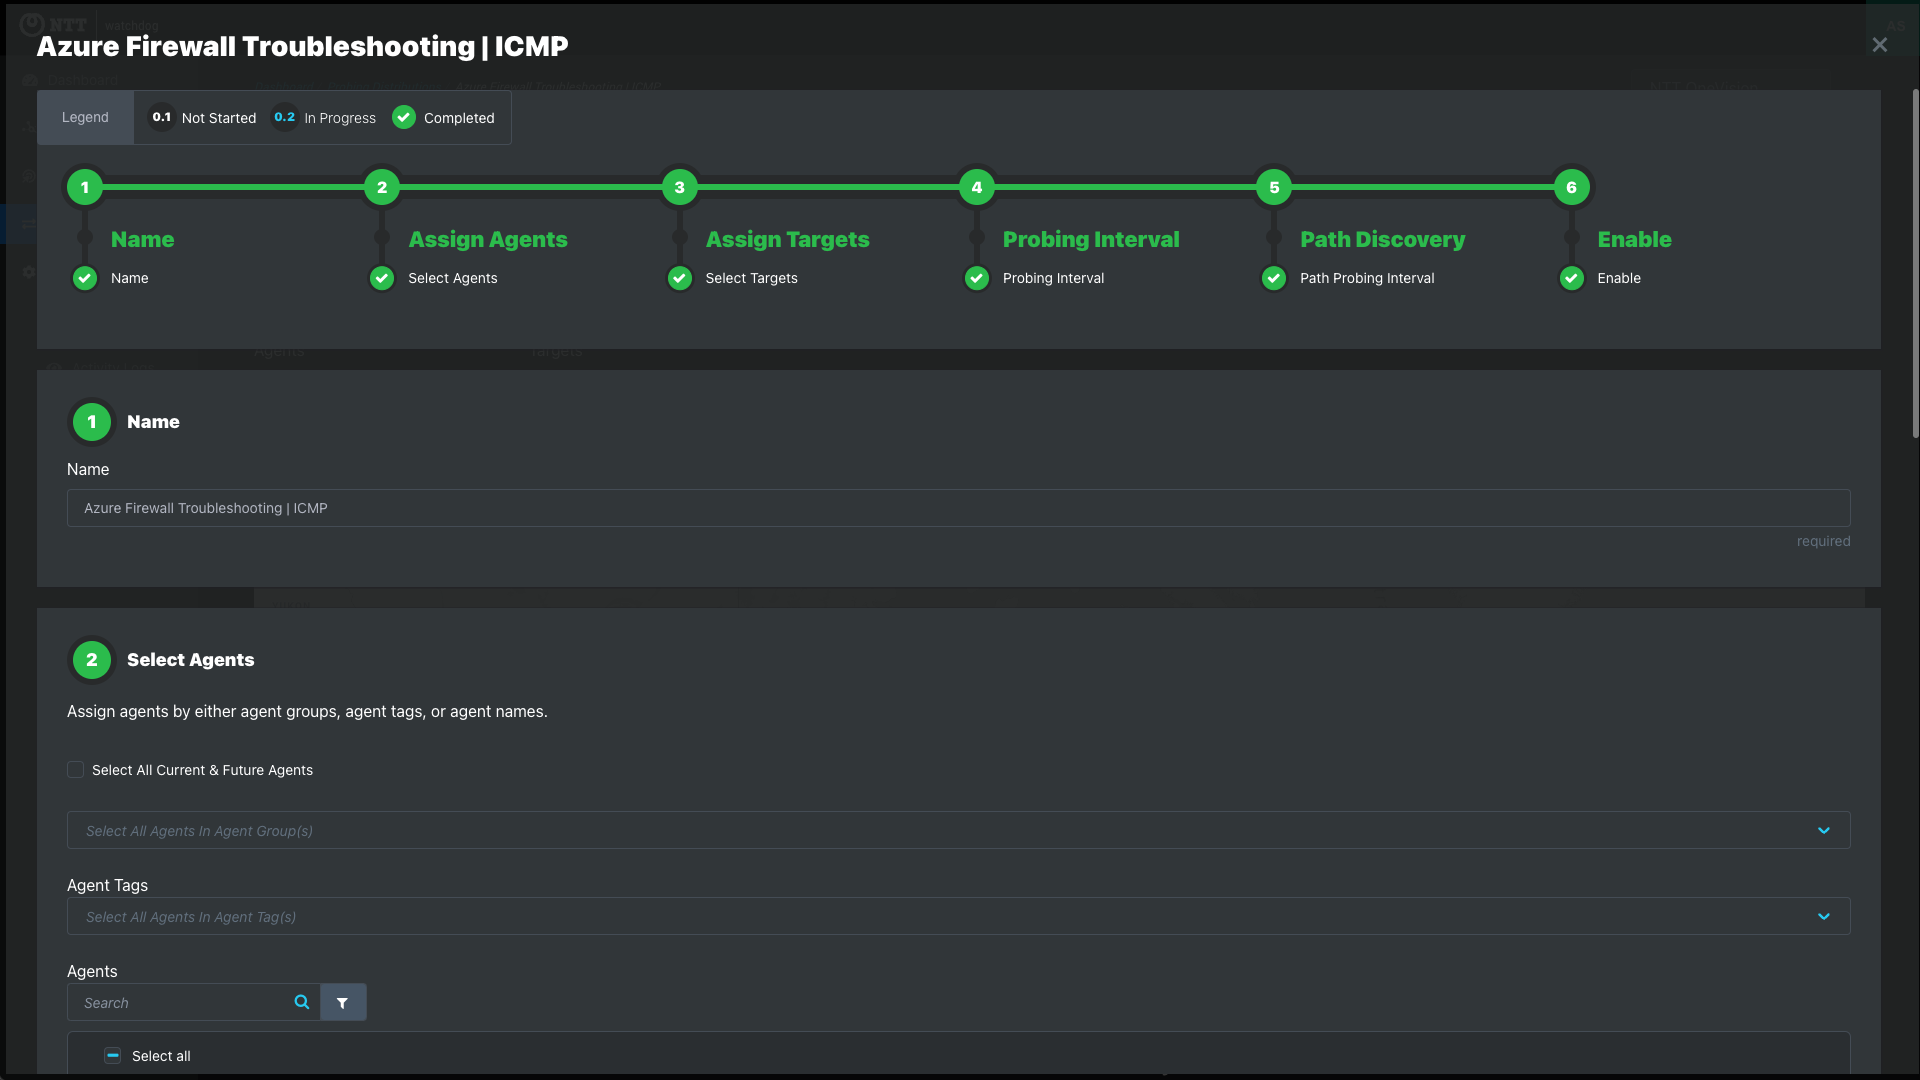
1. Name
| “Campus-to-SaaS | HTTP”: Availability of SaaS services for each client campus using HTTP probing |
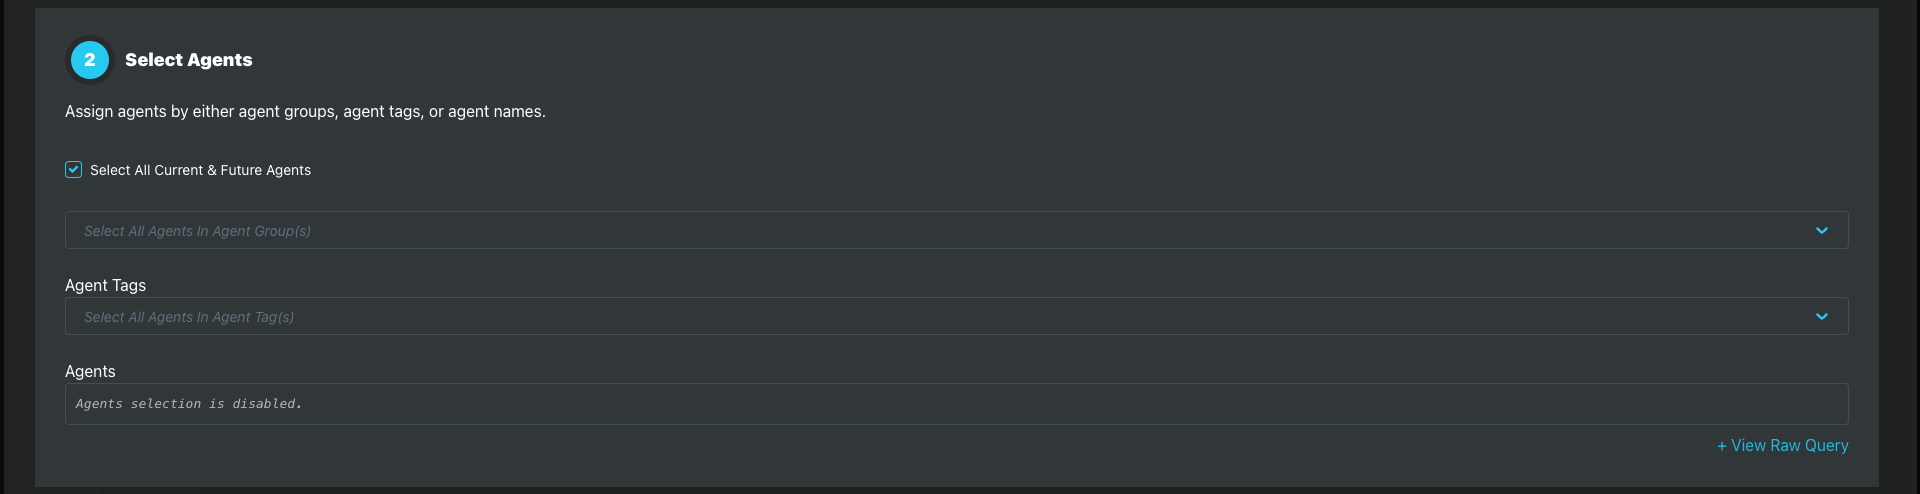
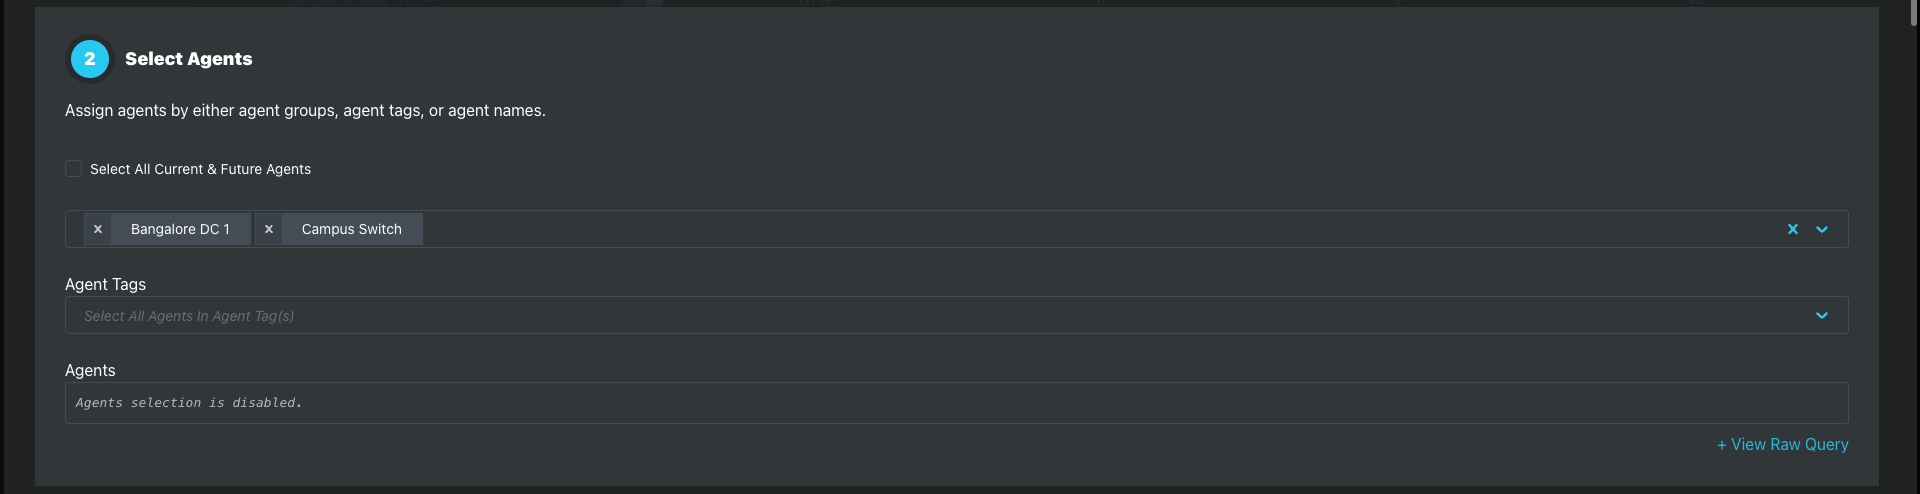
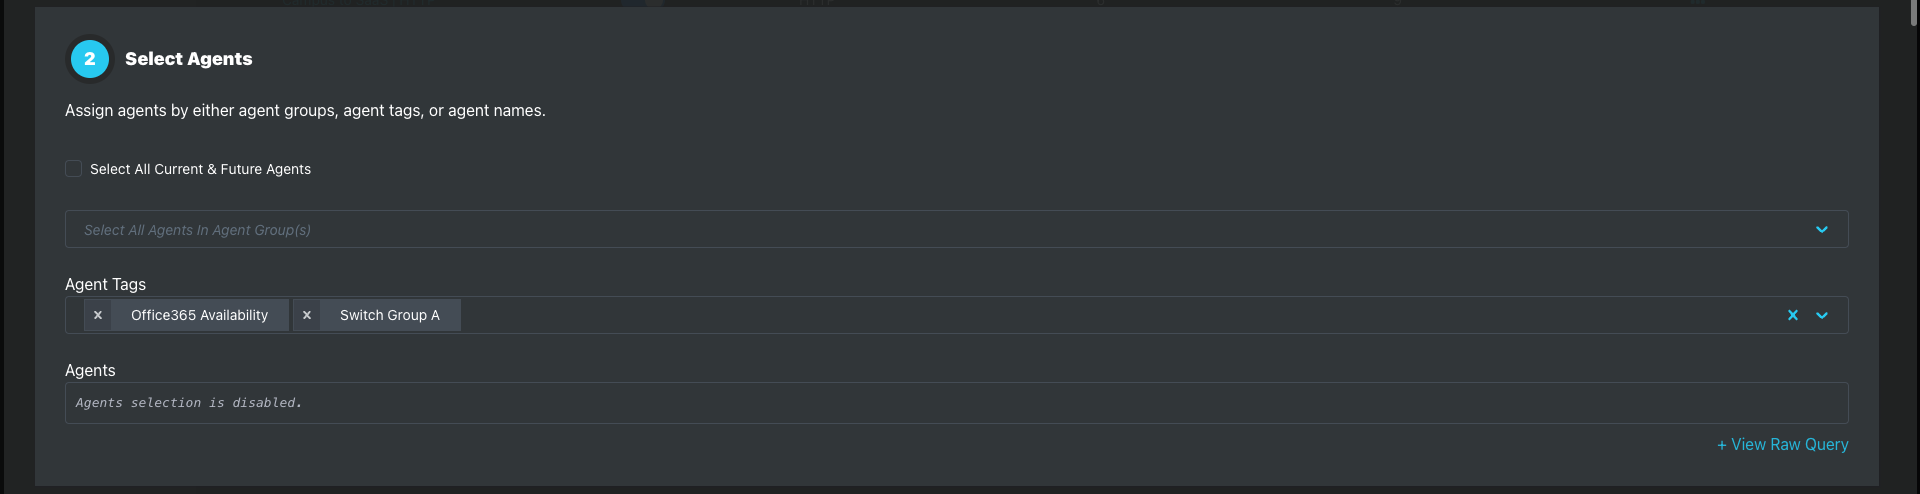
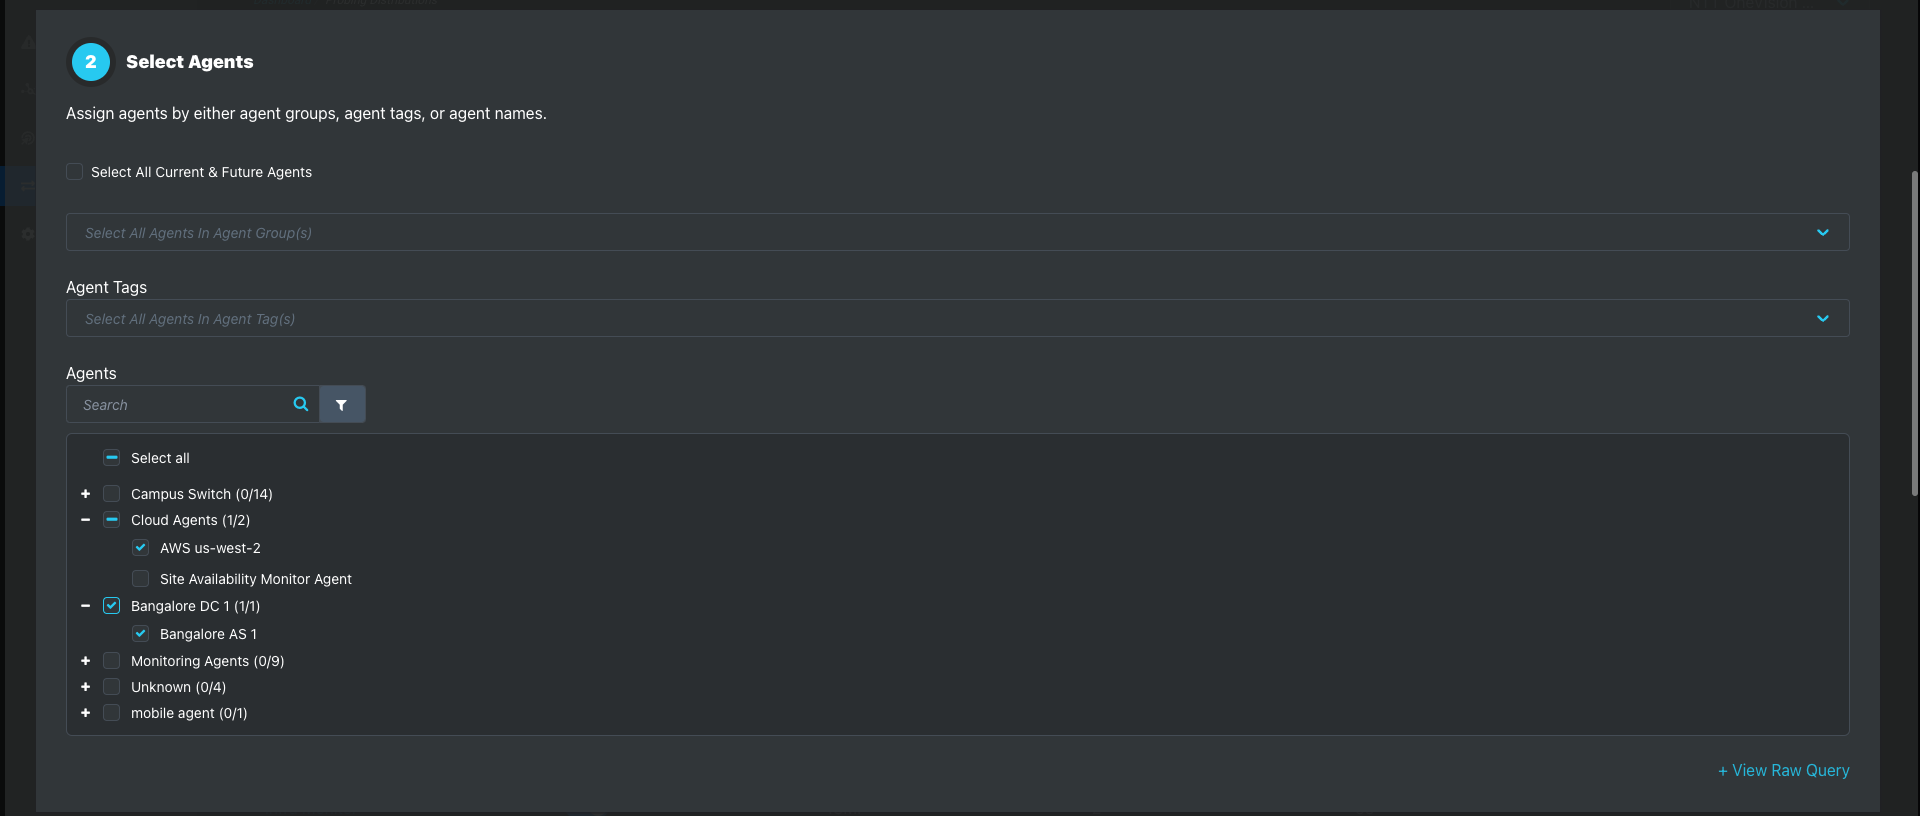
2. Select Agents
Agent selection methods cannot be combined
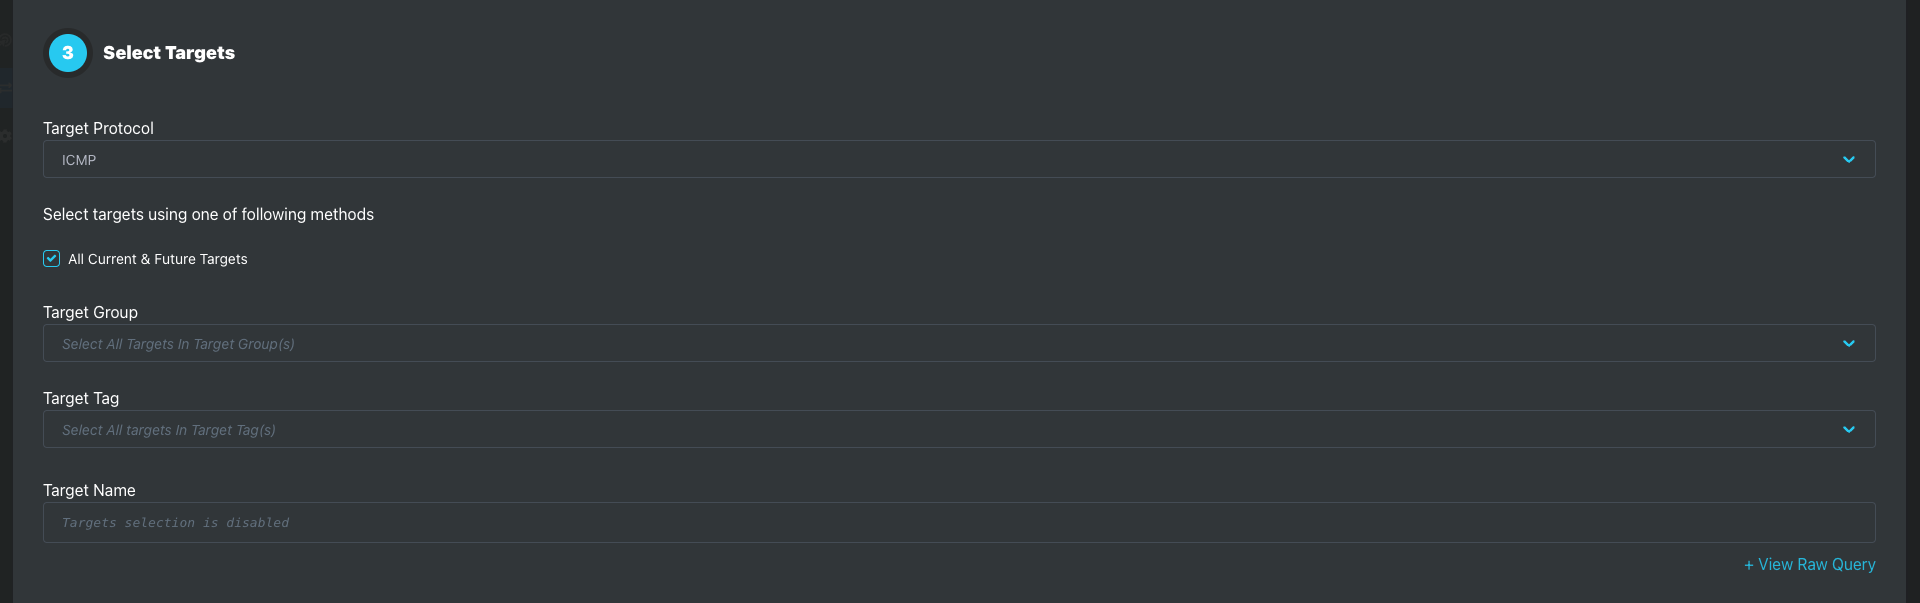
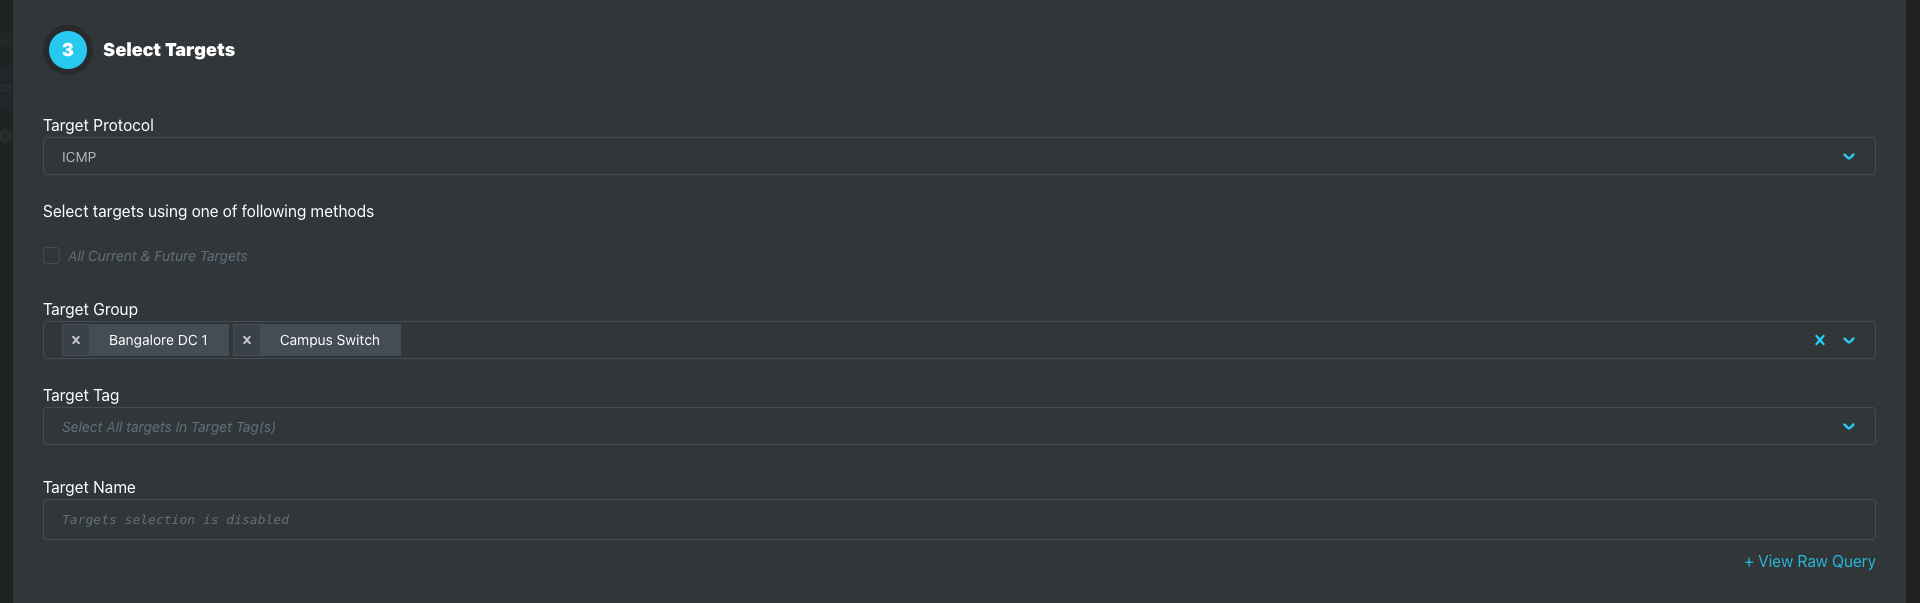
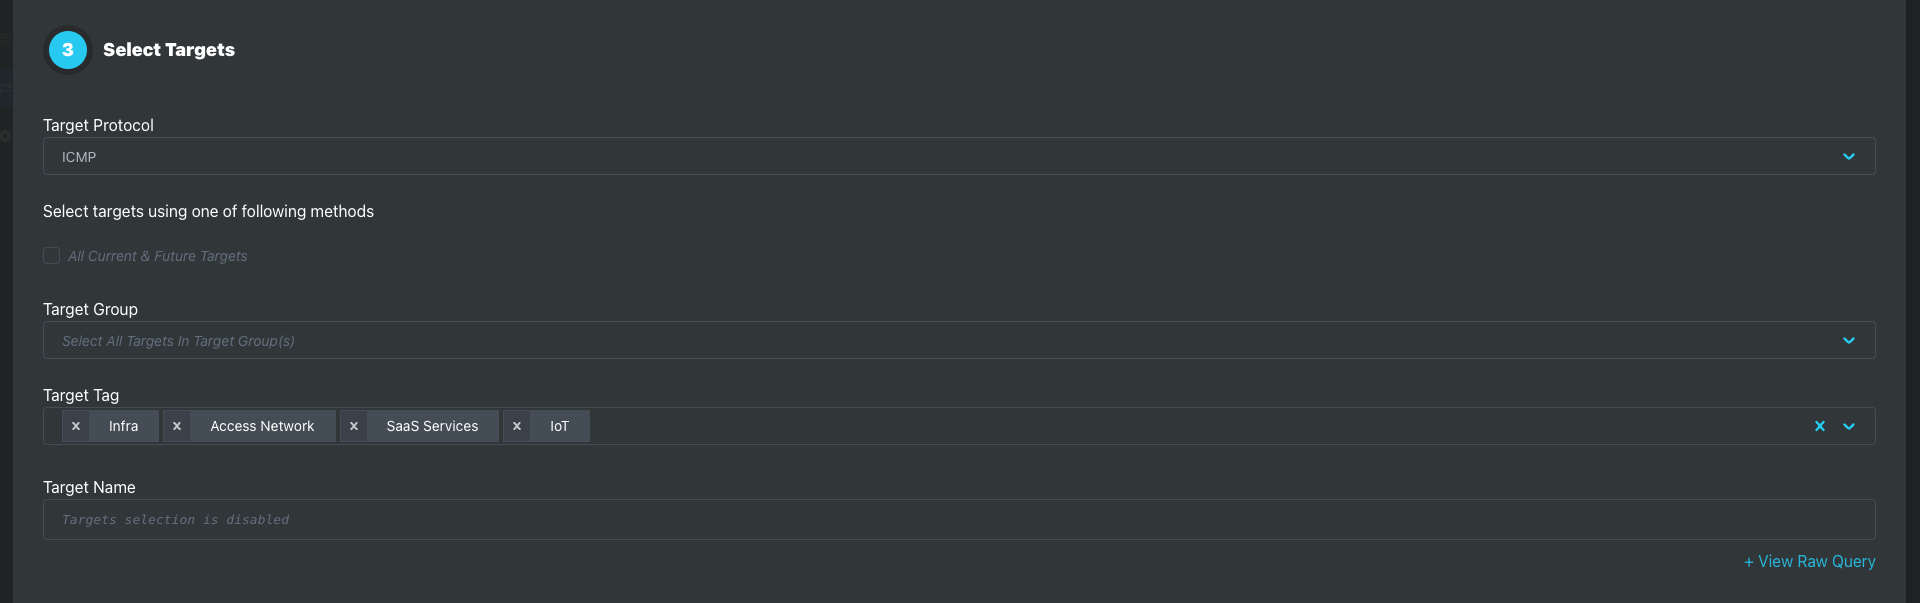
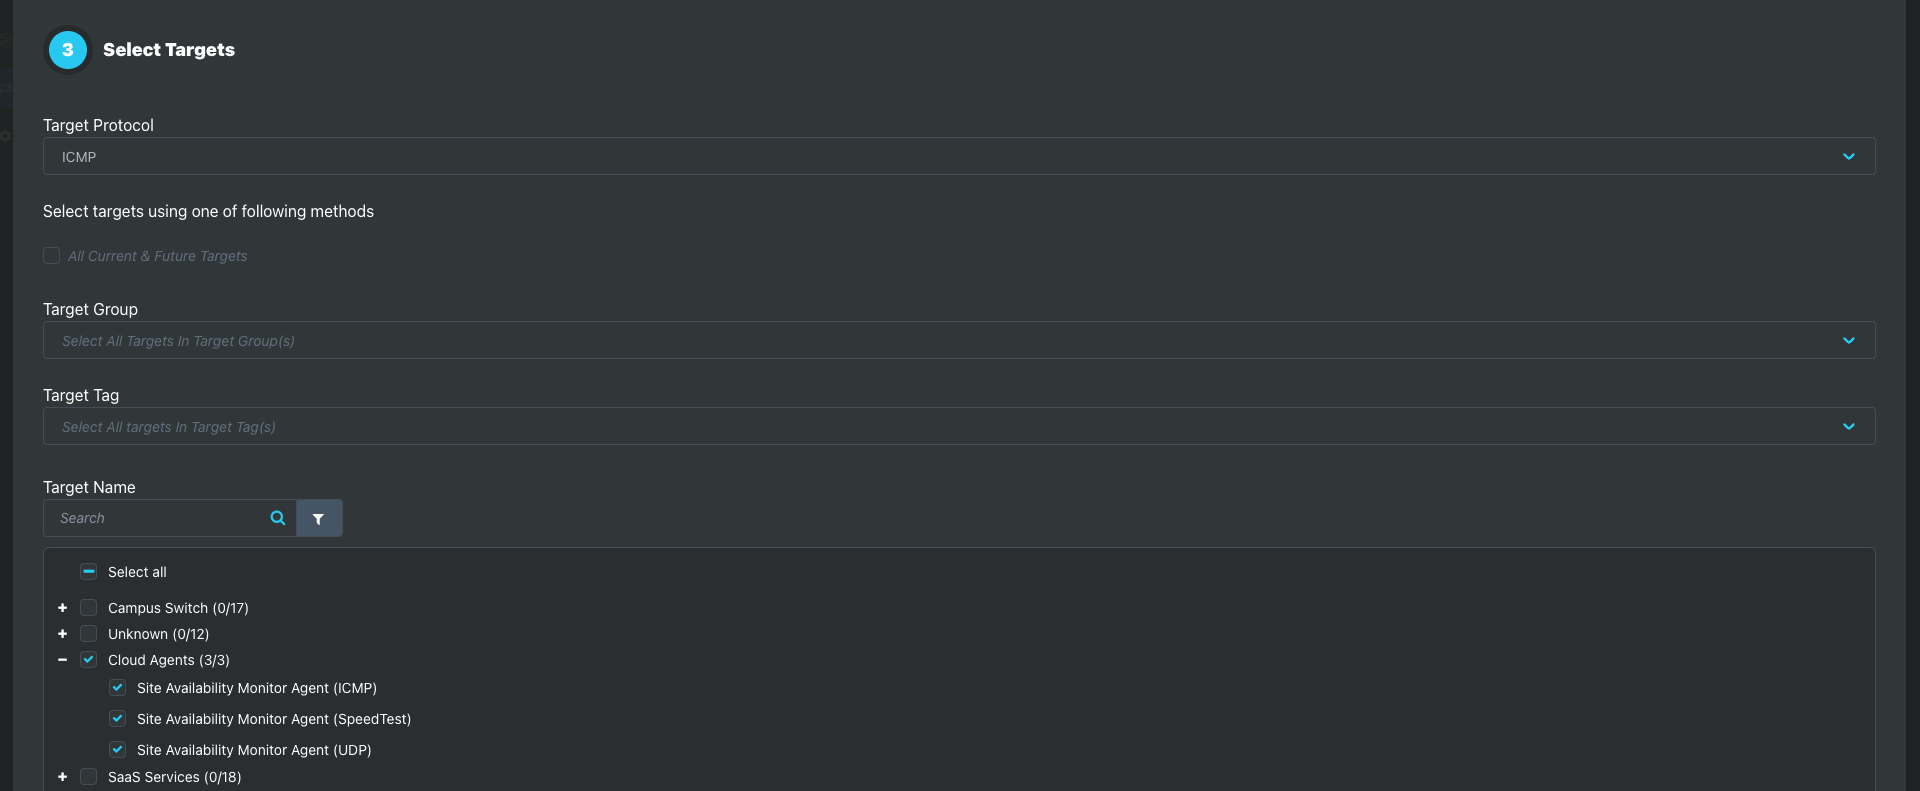
3. Select Targets - Select targets using one of the methods below –Like agent selection, target selection methods cannot be combined.
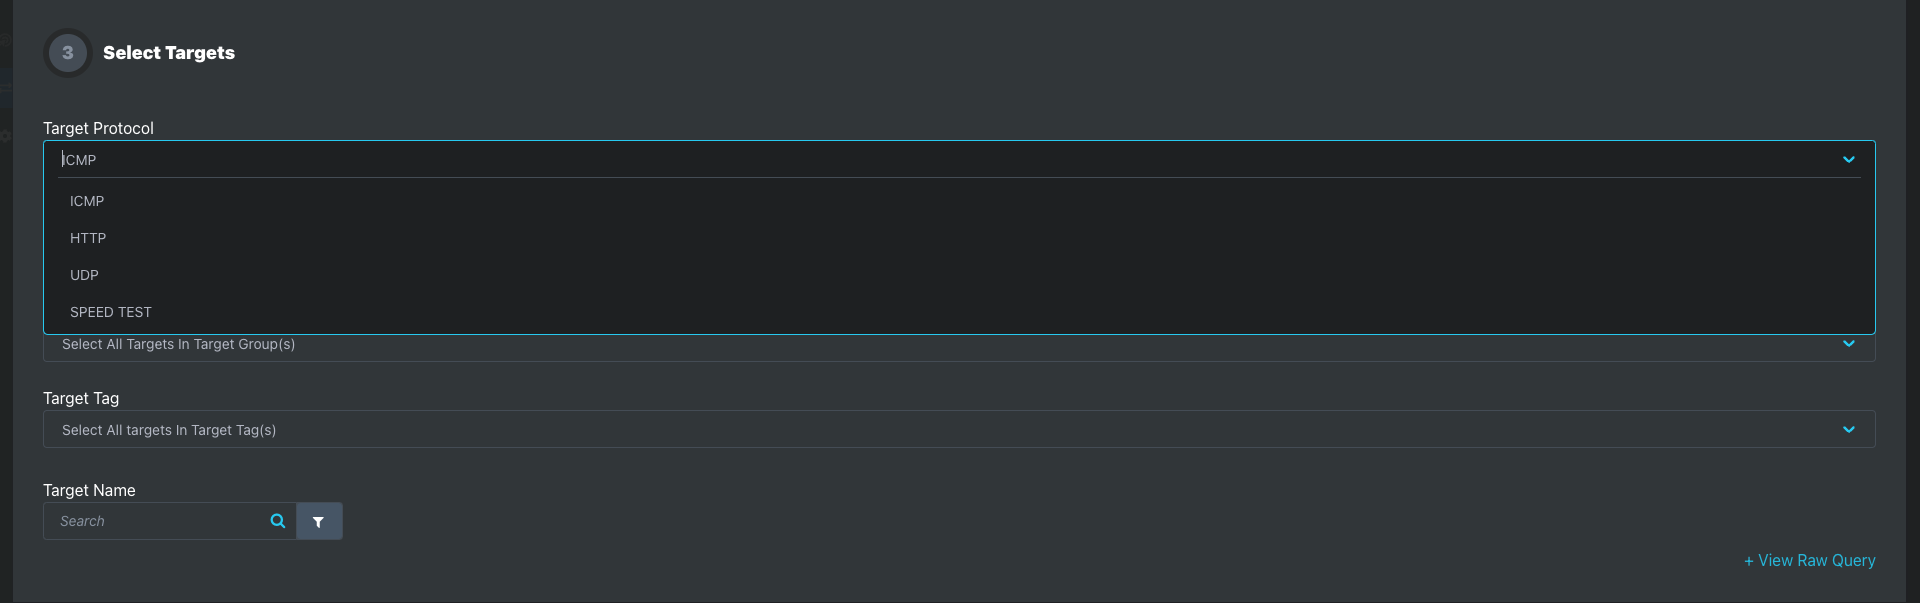
Targets selection methods cannot be combined
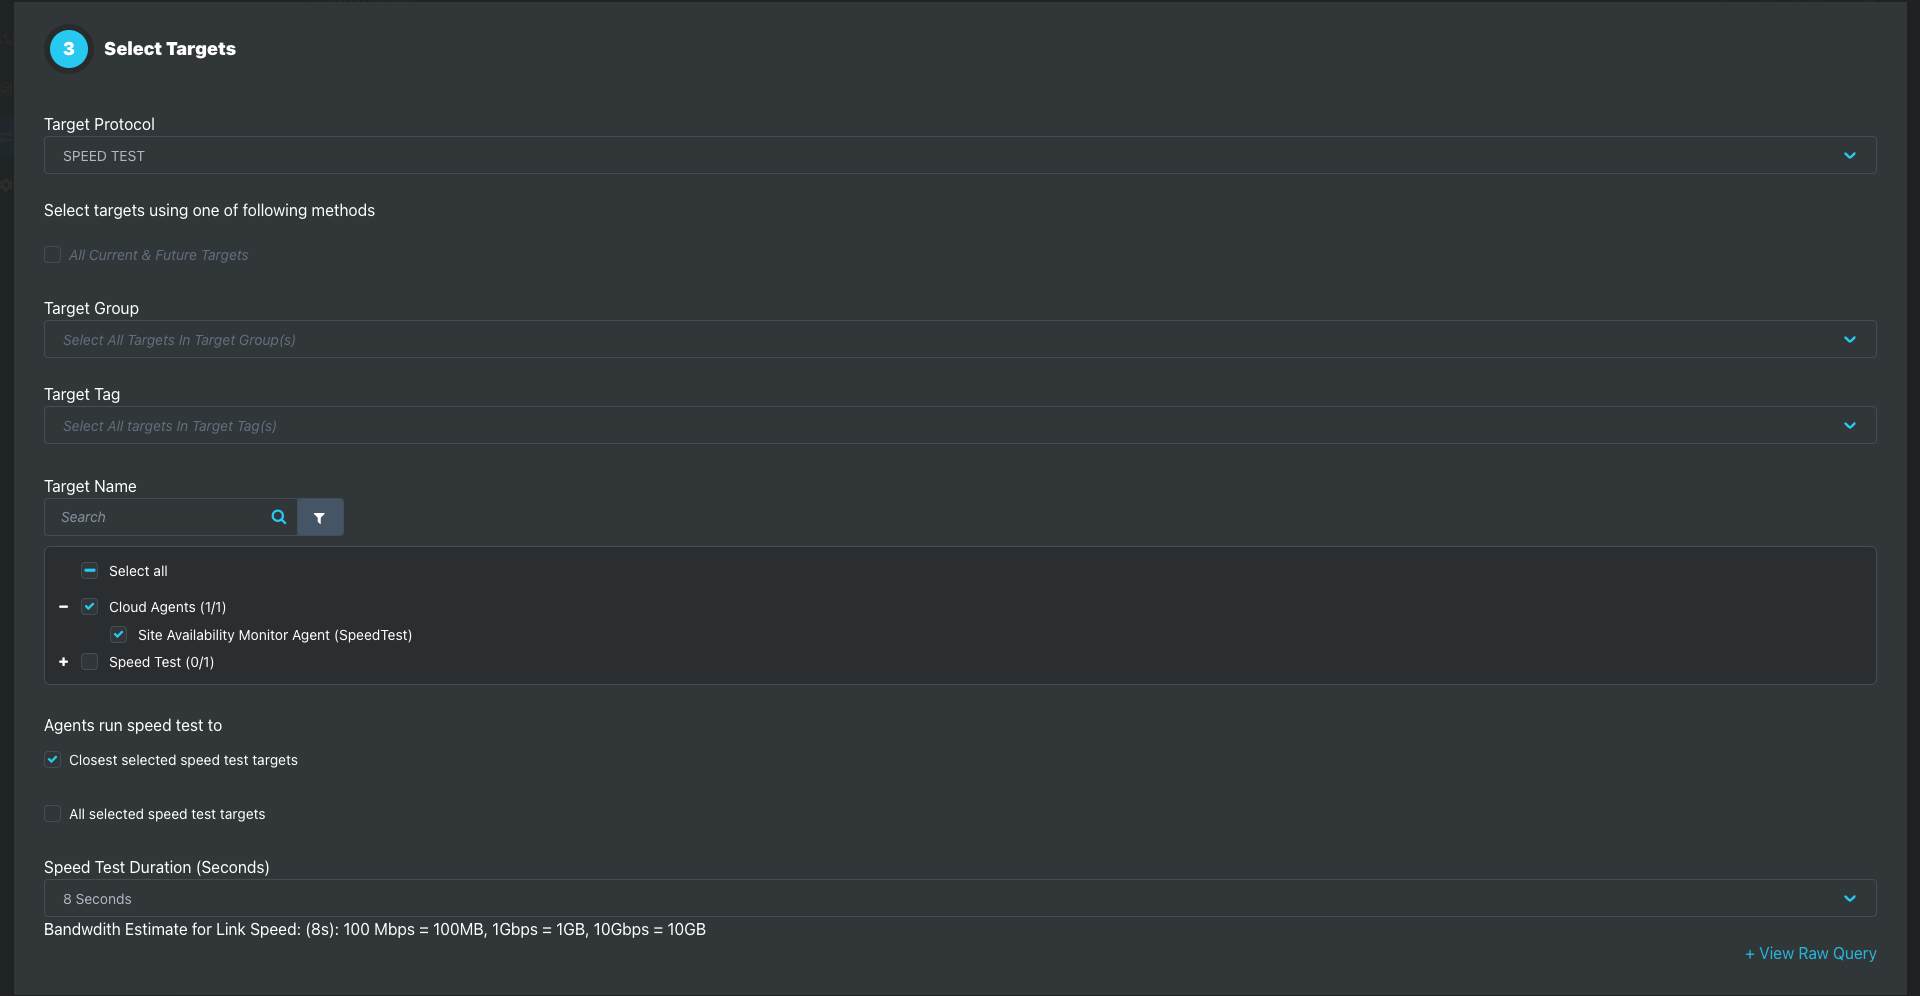
| Duration | Bandwidth Estimate for Link Speed |
|---|---|
| 3 Seconds | 100 Mbps = 37.5MB, 1Gbps = 375MB, 10Gbps = 3.75GB |
| 8 Seconds | 100 Mbps = 100MB, 1Gbps = 1GB, 10Gbps = 10GB |
| 10 Seconds | 100 Mbps = 125MB, 1Gbps = 1.25GB, 10Gbps = 12.5GB |
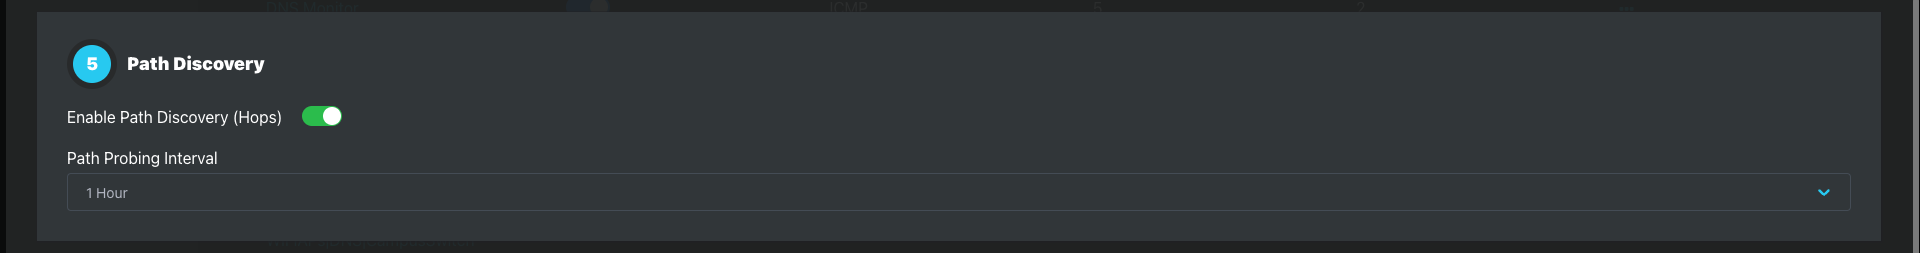
4. Probing interval
Set the probing interval for ICMP, HTTP, and UDP configured probing distributions
| Target Protocol | Min | Max | Default |
|---|---|---|---|
| ICMP | 1 second | 10 minutes | 30 Seconds |
| HTTP | 30 seconds | 10 minutes | 60 Seconds |
| UDP | 100 milliseconds | 10 minutes | 30 Seconds |
Set the probing interval for Speed Test configured probing distributions
5. Path discovery (Hops)
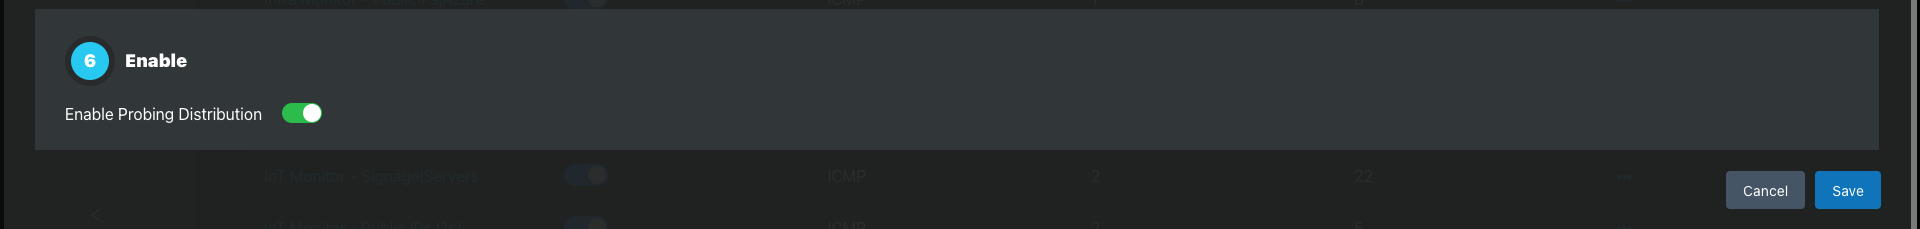
6. Enable and save
In this section
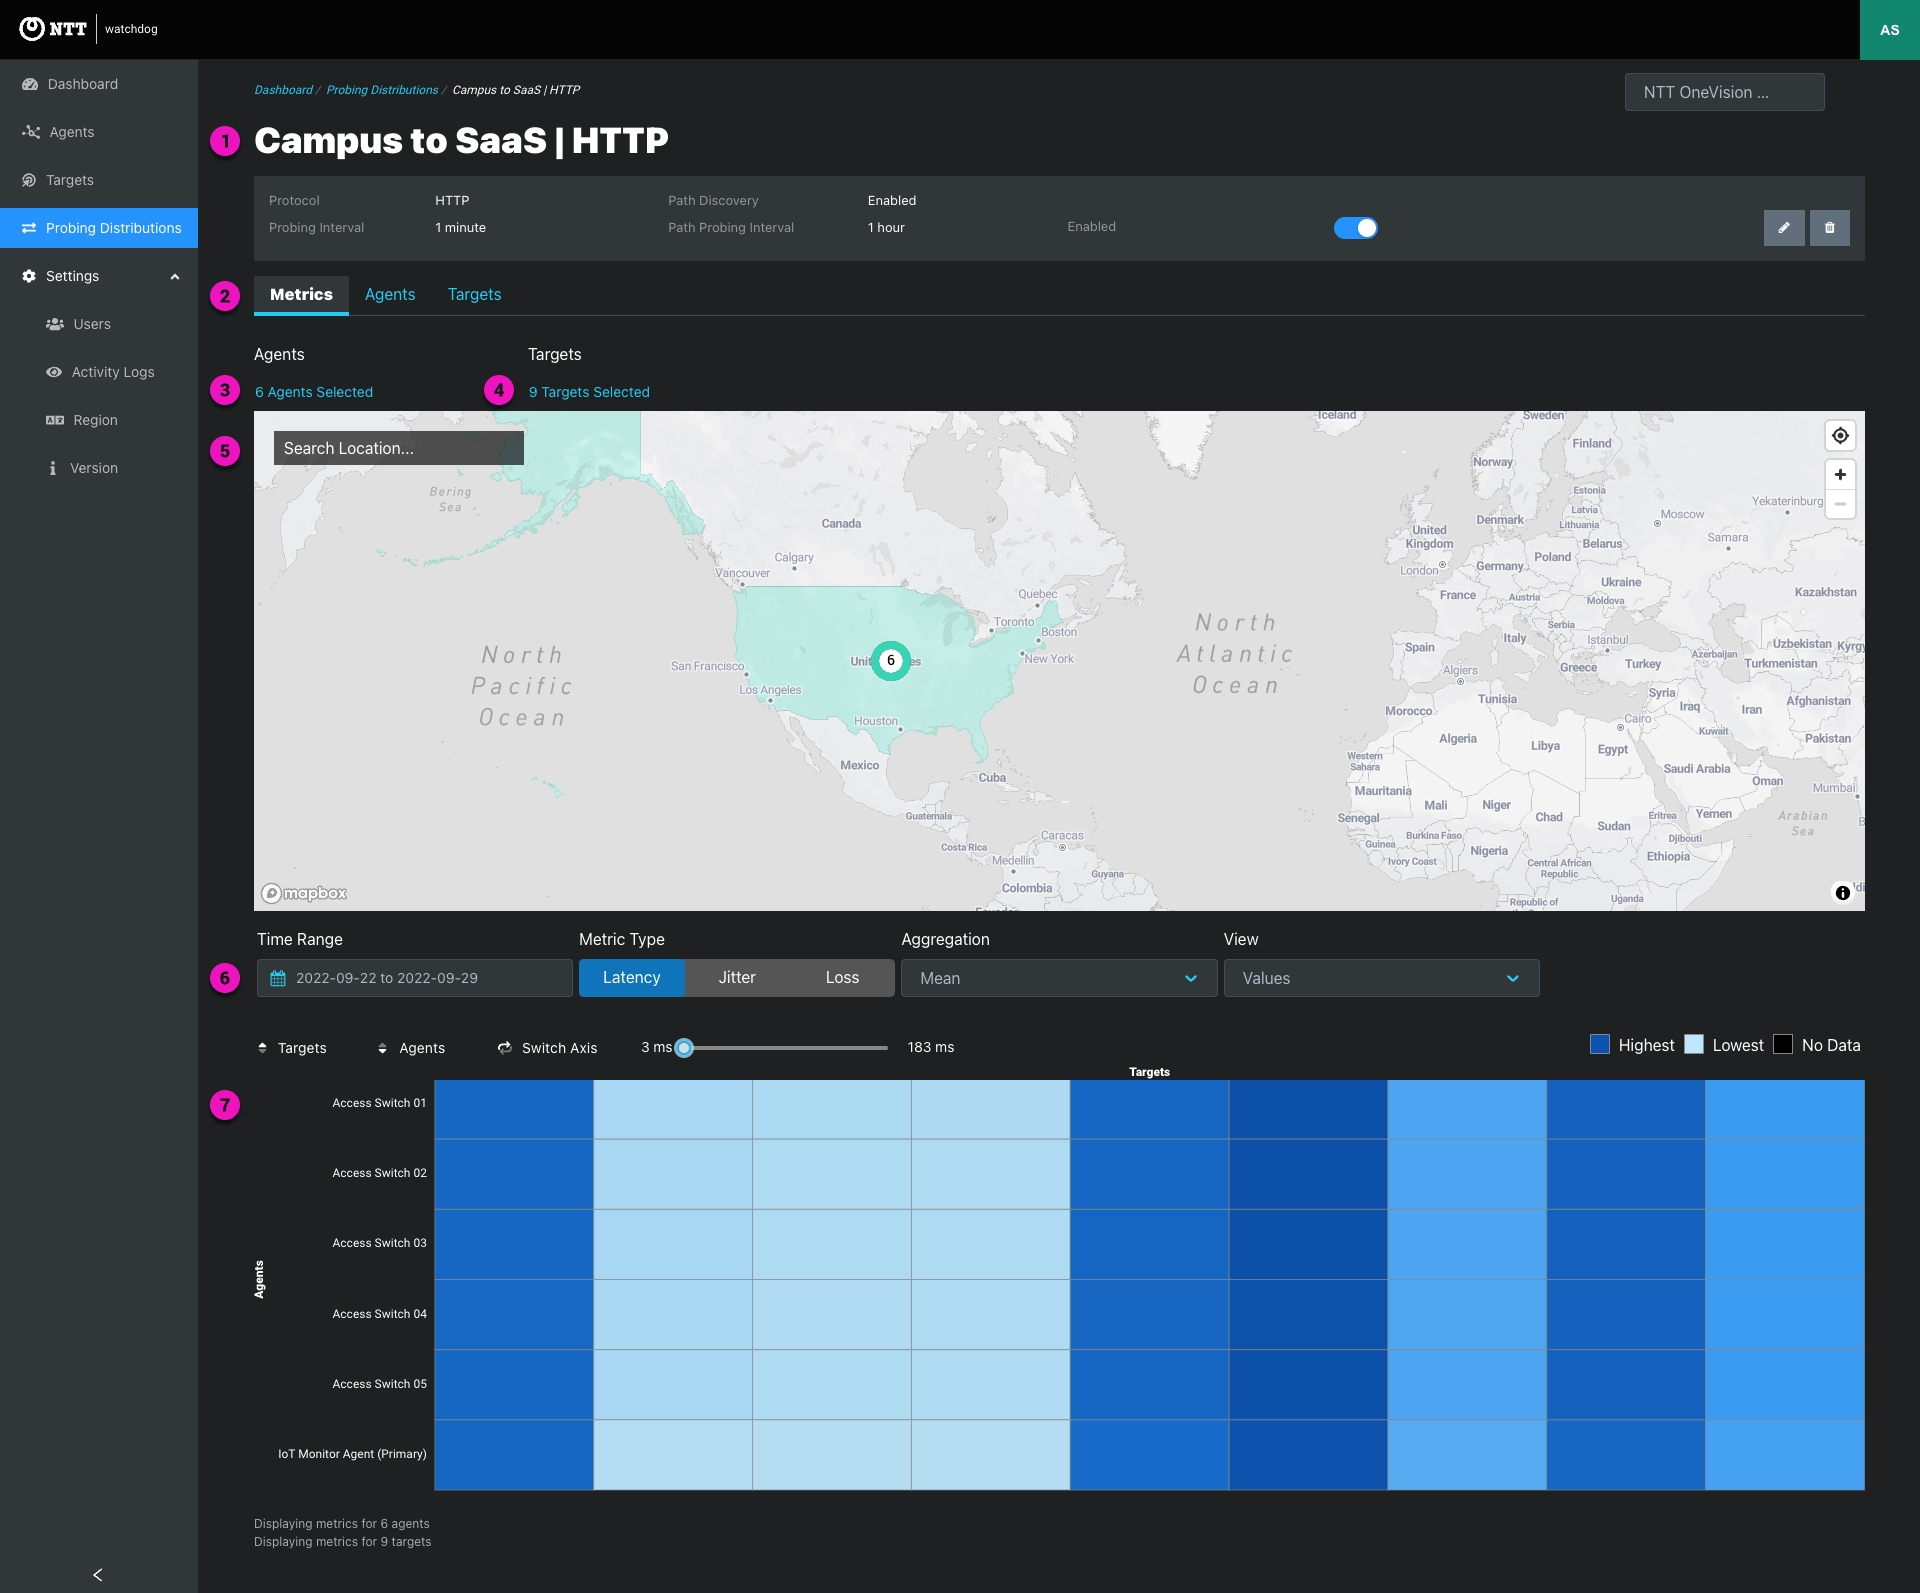
1. Probing distribution summary - view top-level configuration information
2. Metrics, Agents, Targets tabs
3. Agent selector
Click the agent link to Search and filter agents to display
| Filter Key | Operator | Filter options | Usage tip |
|---|---|---|---|
| Activation status | equals | Inactive, Invitation Pending | All pending agents are inactive - Invitation Pending is the invitation status of pending agents using the emailed individual token activation method - Use this filter to view or exclude this unique agent type and state |
| Group | Contains | Groups list (multi-select) | - Filter by groups - Filter by “No Group Assigned” to find ungrouped agents for editing |
| On/Off | equals | Online Agents, Offline Agents (single select) | Filter the by “Offline Agents” to quickly identify which agents are currently offline |
| OS | contains | Linux, macOS, Windows (multi-select) | Filter list by tags assigned to agents |
| Tags | contains Any | Tags list (multi-select) | Filter by OS - EdgeLQ OS returns Cloud Agents and Static Agents deployed on dedicated hardware |
| ISP | equals | ISP list (single select) | List shows the last ISP reported for the agents enrolled in the probing distribution |
| Contact | equals | Text (exact match) | Use text search if the exact spelling of the name is unknown |
4. Target selector
Click the target link to Search and filter targets to display
| Filter Key | Operator | Filter options | Usage tip |
|---|---|---|---|
| Group | contains | Groups list (single select) | - Filter by groups - Filter by “No Group Assigned” to find ungrouped agents for editing |
| Tags | contains Any | Tags list (multi-select) |
5. Map view
| Map Area Zoom Levels | Example |
|---|---|
| Country | Japan, UK, India |
| Admin Area 1: State, Prefecture, Nation (UK) | California, Kumamoto, Wales |
| Admin Area 2: County, Municipality | Berkshire, Santa Clara, Offenbach |
| Admin Area 3: City | New York, Tokyo, Hyderabad |
6. Heatmap Options
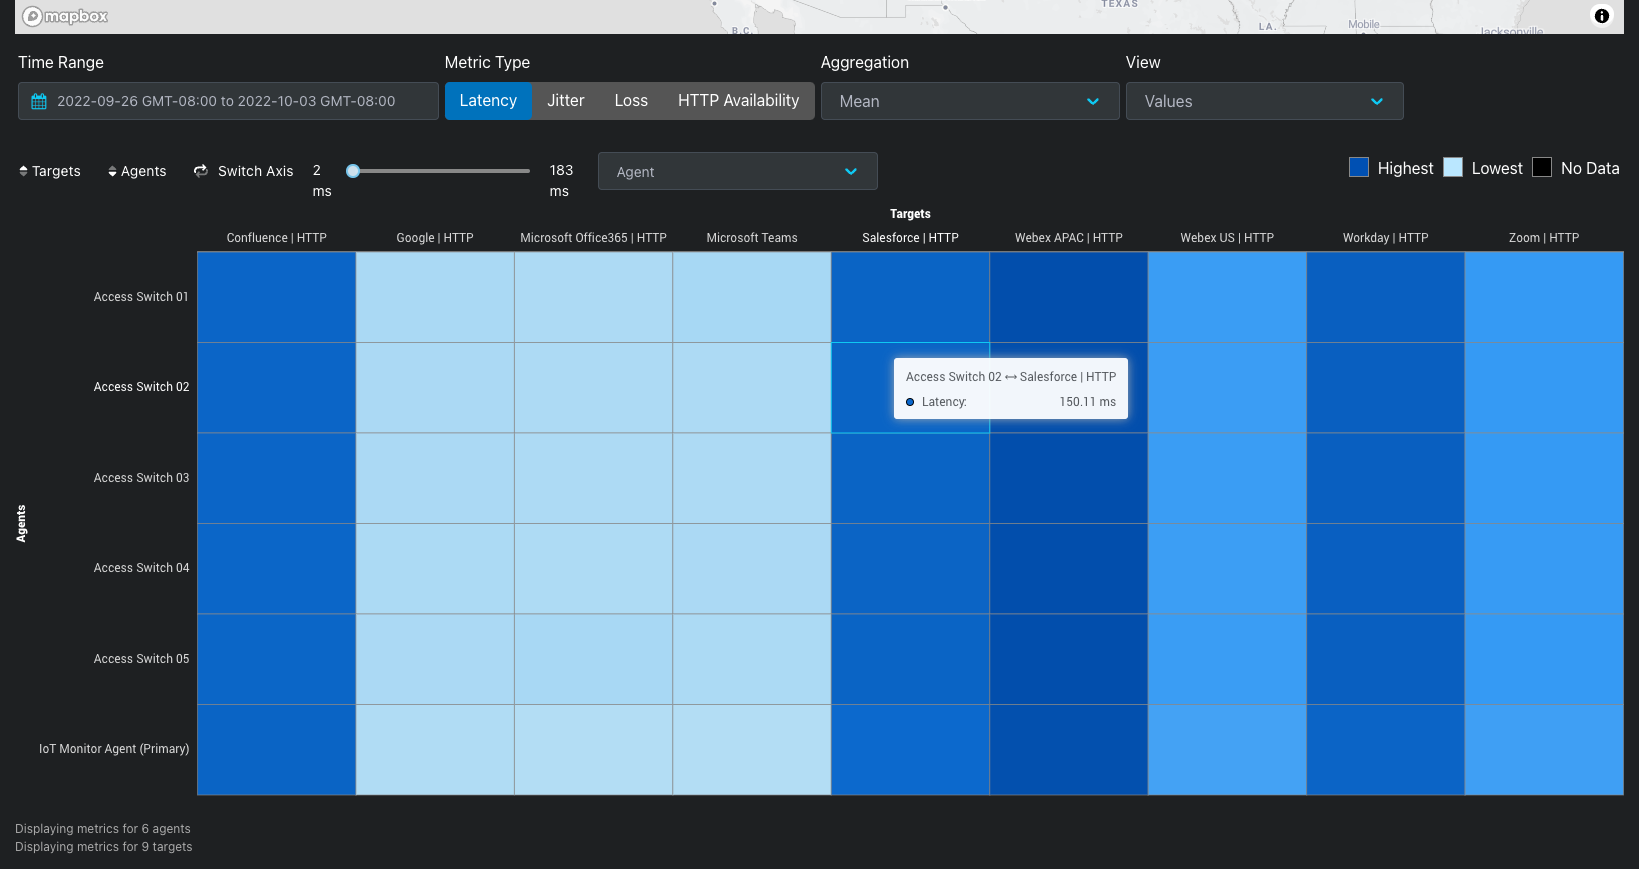
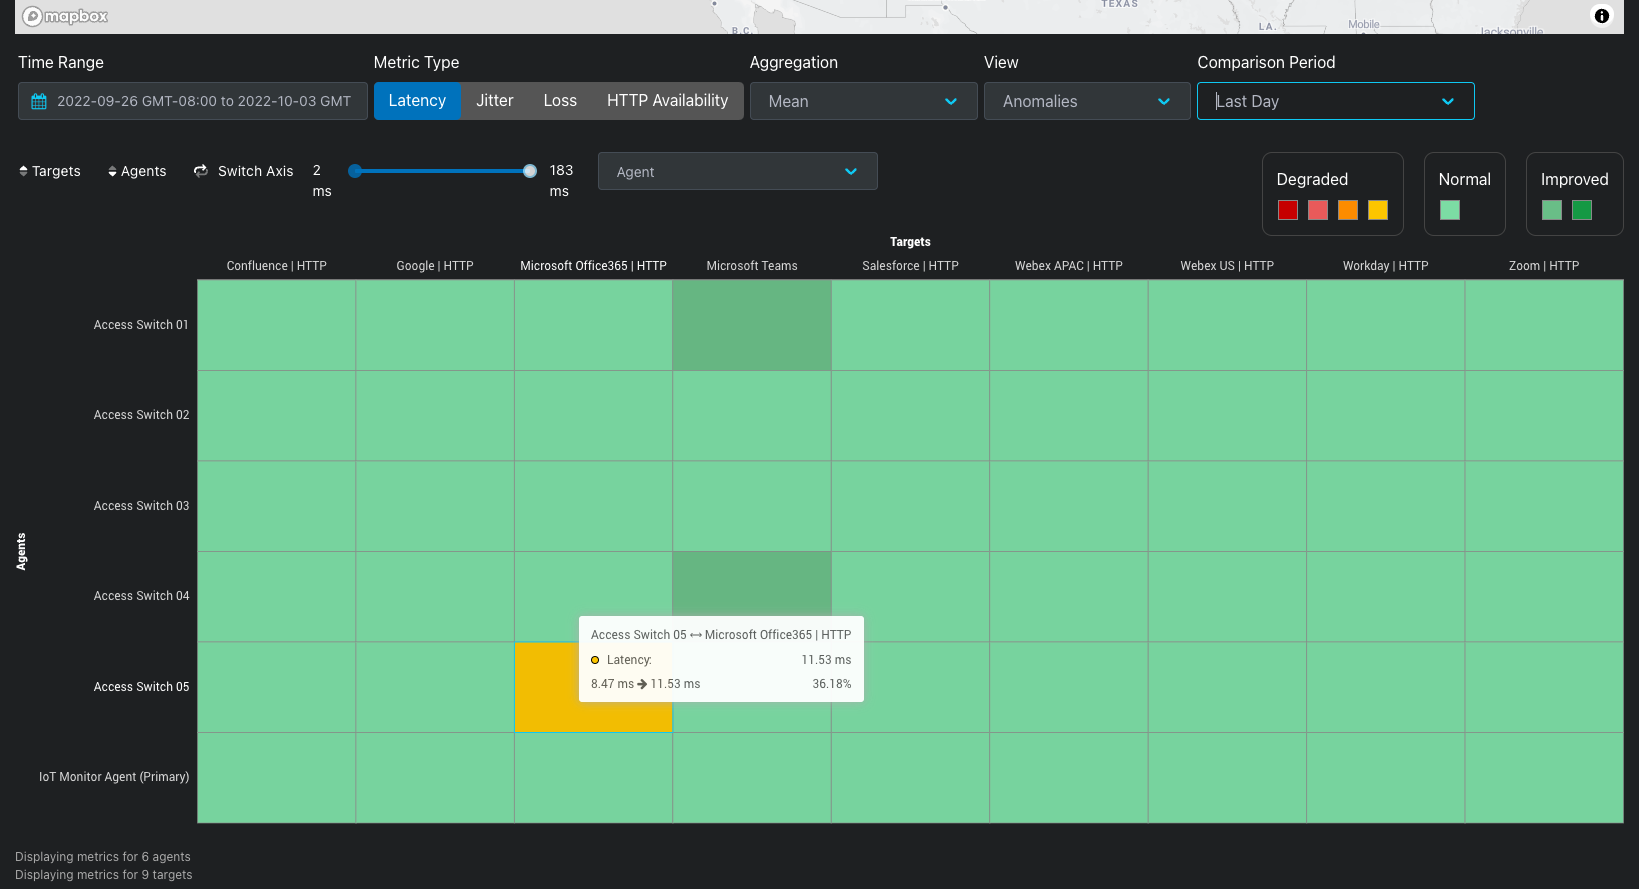
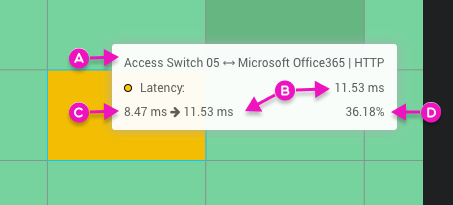
| Target: Microsoft Office365 | HTTP |
Agents enrolled in the probing distribution
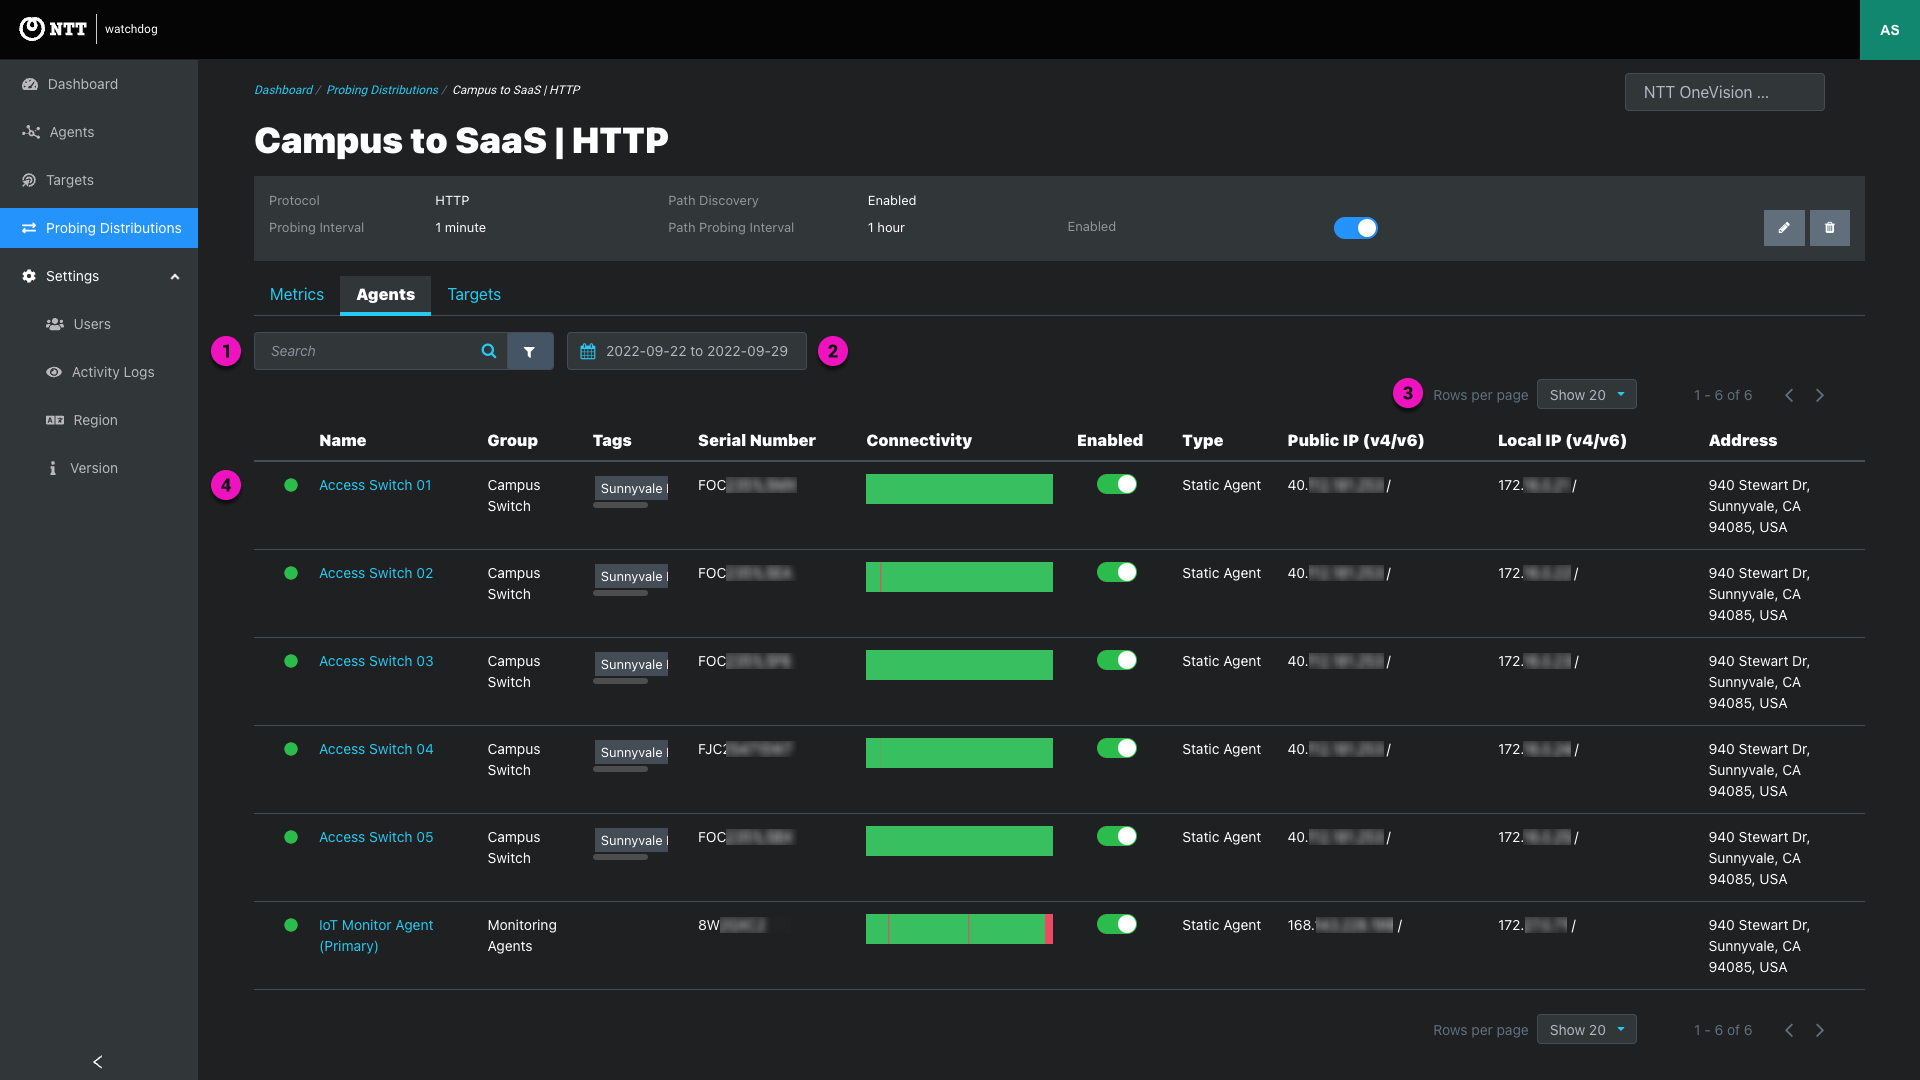
1. Search and filters
Click the agent link to Search and filter agents to display
| Filter Key | Operator | Filter options | Usage tip |
|---|---|---|---|
| Activation status | equals | - Inactive - Invitation Pending | All pending agents are inactive - Pending agents utilizing emailed individual token activation have the Invitation Pending status - Use this filter to view or excluded this unique agent type and state |
| equals | Text (exact match) | - Agent’s contact email address - Use text search if the exact email address is unknown | |
| Group | contains | Groups list (multi-select) | - Filter by groups - Filter by “No Group Assigned” to find ungrouped agents for editing |
| Name | equals | Text (exact match) | Use text search if the exact spelling of the name is unknown |
| Type | equals | Cloud Agent, Mobile Agent, Static Agent, (multi-select) | |
| Online/Offline | equals | Online Agents, Offline Agents (single select) | Filter the by “Offline Agents” to quickly identify which agents are currently offline |
| OS | contains | Linux, macOS, Windows (multi-select) | |
| Serial Number | equals | Text (exact match) | |
| Tags | contains Any | Tags list (multi-select) | |
| Version | equals | Text (exact match) | Agent software version number like “v3.0.1” |
2. Date selector - Set the time range of the connectivity graphic in each row. The agent table time range defaults to the last 48 hours
3. Pagination
4. Table Sorting
5. Agents list
| Column | Displayed Value |
|---|---|
| Online Agent –Agent successfully connected to the controller Offline Agent –Agent not connected to the controller | |
| Name | - Agent’s display name link - Click through to the agent page to view metrics and information about the agent |
| Group | Group assigned to the agent |
| Tags | Tag(s) assigned to the agent |
| Serial Number | - Host device serial number for static or mobile agents - VM serial number for cloud agents |
| Connectivity | - Connectivity graphic shows agent connectivity for the dates shown in the date selector - Green indicates when the agent was online - Red show when static and cloud agents were disconnected - Gray shows when mobile agents were disconnected. Gray is used for mobile agents because they are expected to be offline when the host PC is not in use - Hover over a colored section to view when and how long the agent was connected or experienced a connectivity issue |
| Enabled | Agent Enabled, Agent Disabled - Toggle agents from enabled to disabled - Enable or disable multiple agents using bulk edit - This action is also available on the agent page and agent editing modal |
| Type | Type of agent –Cloud agent, mobile agent, or static agent |
| Public IP(v4/v6) | - Last public IP returned by the agent - Displays the agent’s public IPv4 address. IPv6 displayed if available - Public IP not displayed for disabled agents |
| Local IP(v4/v6) | - Last local IP returned by the agent - Displays the agent’s public IPv4 address. IPv6 displayed if available - External IP not displayed for disabled agents |
| Address | - Agent’s primary location - Full or partial address shown - Lat/long input as the agent’s location resolves to the nearest address |
Targets enrolled in the probing distribution
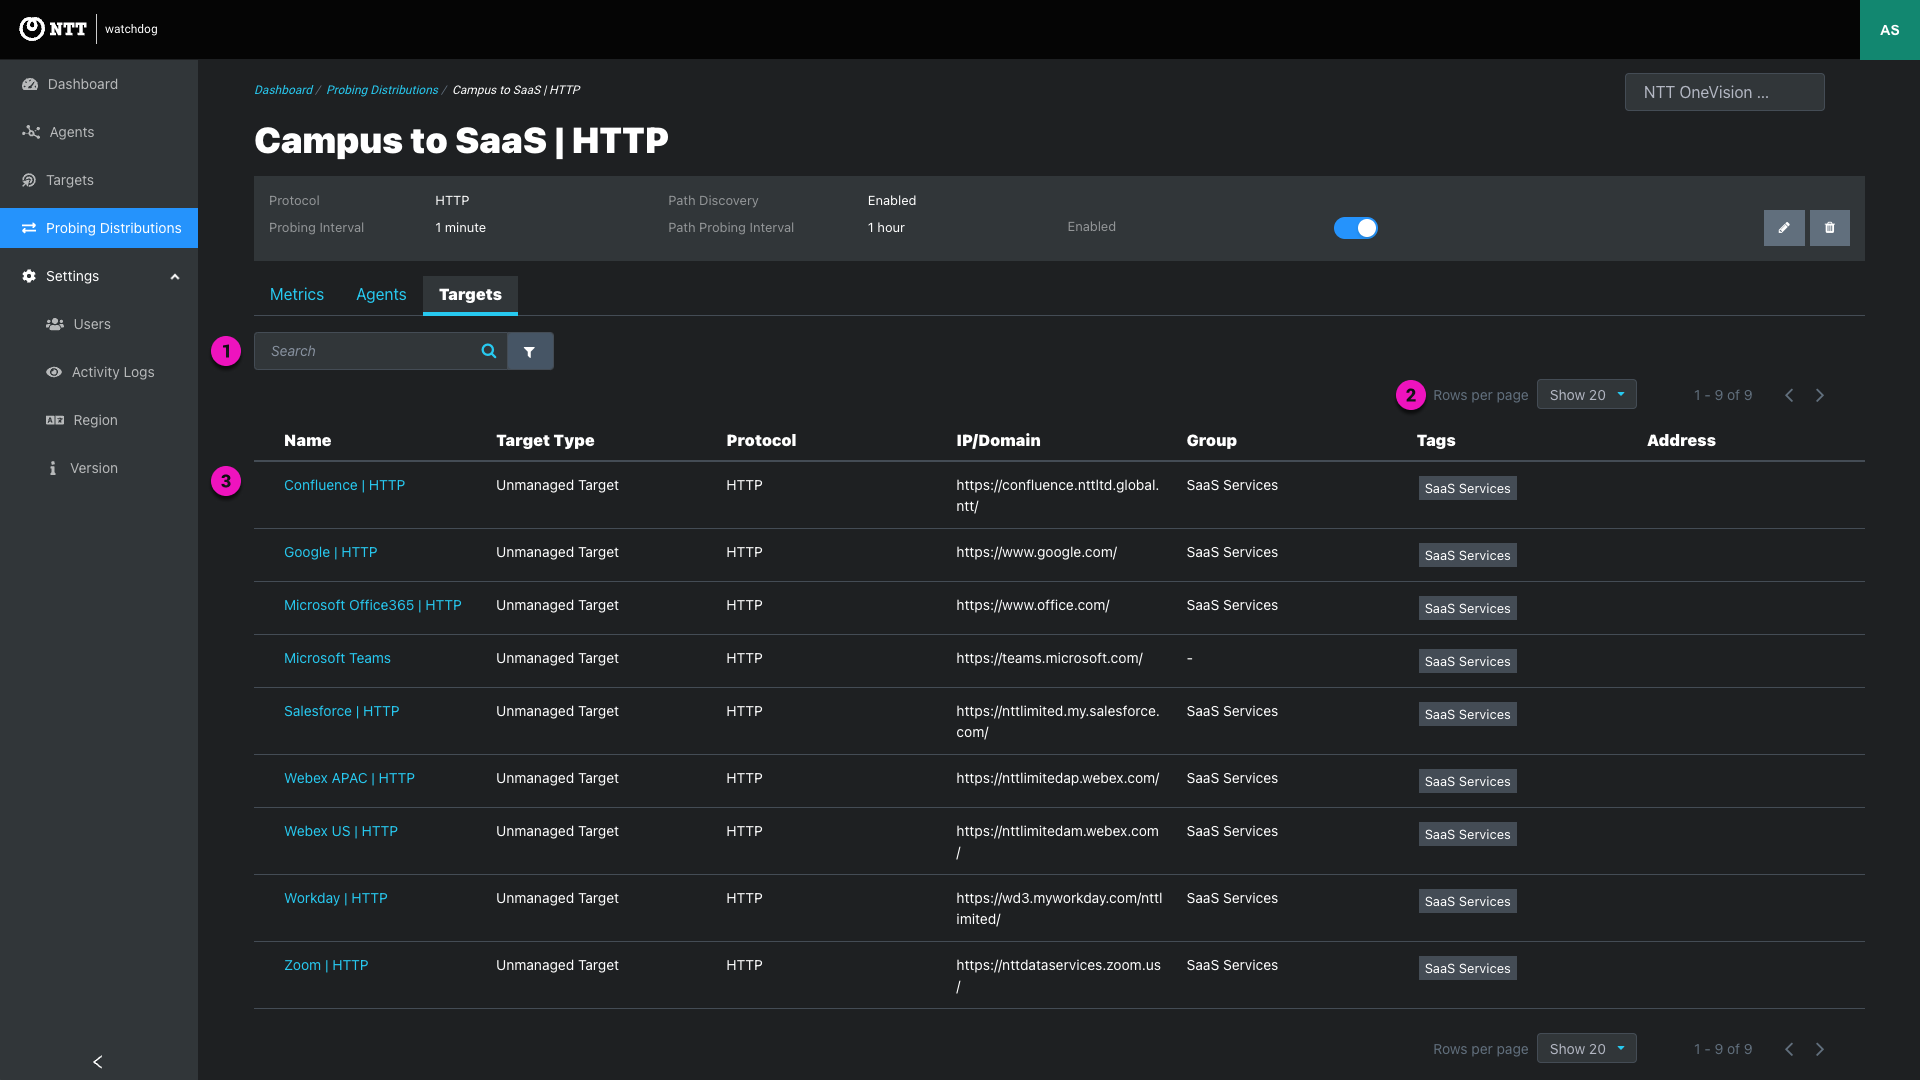
1. Search and filters
Click the agent link to Search and filter agents to display
| Filter Key | Operator | Filter options | Usage tip |
|---|---|---|---|
| Protocol | equals | ICMP, HTTP, UDP, Speed Test, Unspecified (single select) | Probing distributions support a single target protocol Filter will be removed in next release |
| IP/Domain | equals | Text (exact match) | - Use text search if exact IP or domain is unknown Filter is helpful when combined with a text search used for a different target attribute |
| Group | contains | Groups list (single select) | - Filter by groups - Filter by “No Group Assigned” to find ungrouped agents for editing |
| Tags | contains any | Tags list (single select) | - Filter by a single target tag |
2. Pagination
3. Table Sorting
4. Target list
| Column | Displayed Value |
|---|---|
| Name | - Target’s display name link - Click through to the target page to view metrics and information about the agent |
| Target Type | Managed Target, Unmanaged Target |
| Protocol | ICMP, HTTP, UDP, Speed Test |
| IP/Domain | IP or domain for the target |
| Group | Group assigned to the agent |
| Tags | Tag(s) assigned to the agent |
| Address | Primary address for managed target agents Addresses manually added to an unmanaged target record are shown |
Edit or delete one or more agents using the following methods:
1. Actions ellipsis on active and pending agent table rows 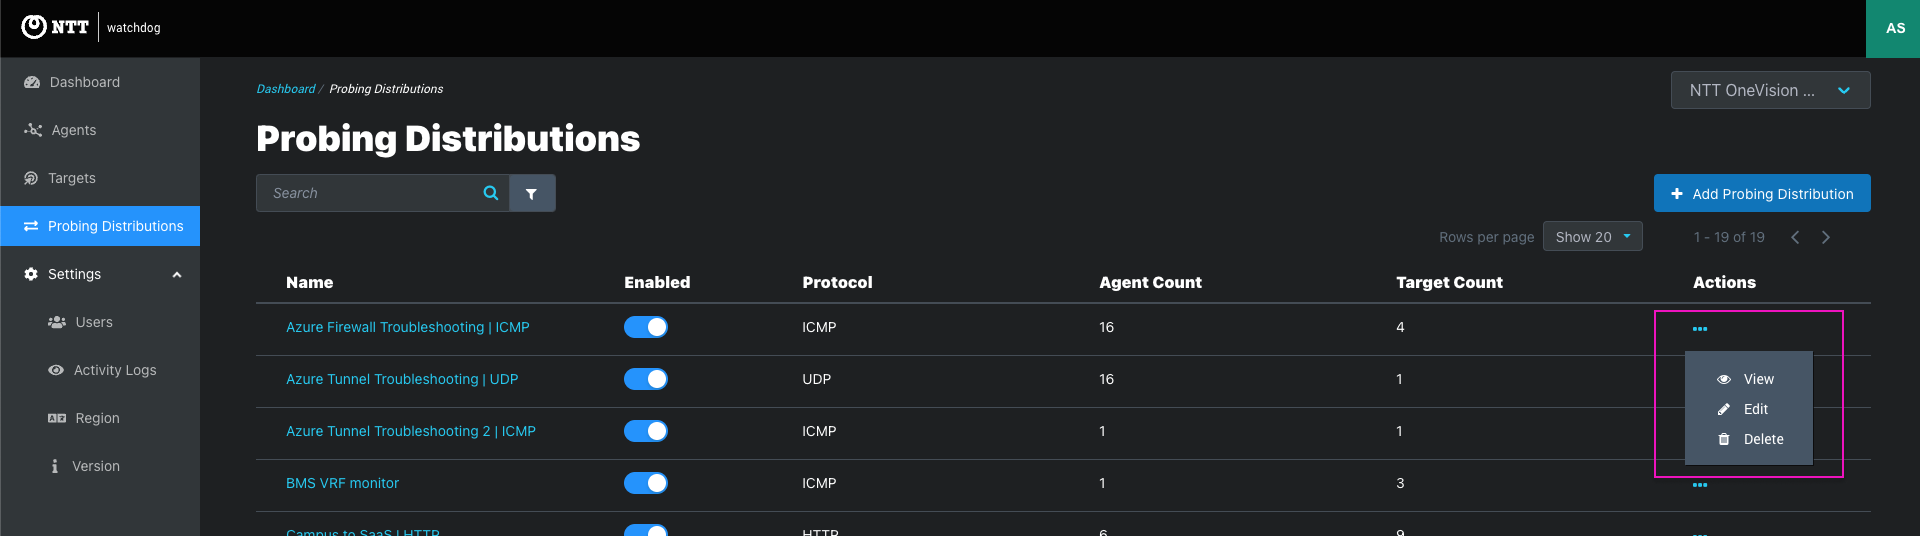
2. Probing Distribution summary panel 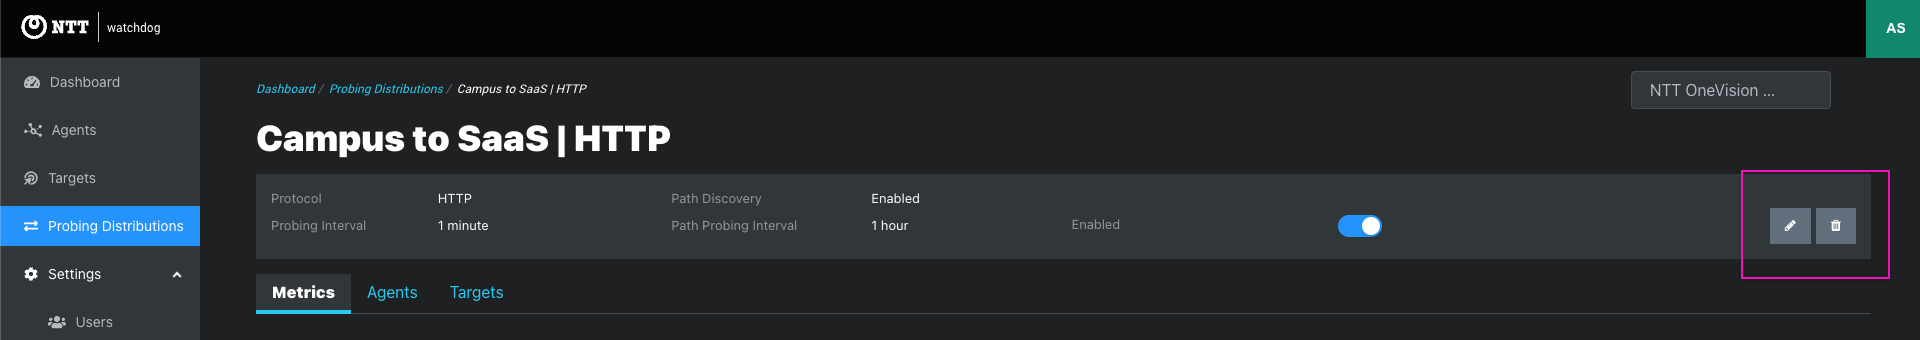
The editing modal shows the complete probing distribution configuration: