| Admin | Co-admin | Asset Manager | Viewer | ||
|---|---|---|---|---|---|
| Alerts | View | ||||
| Alert Policies | View | ||||
| Add/Edit/Delete | |||||
| Notification Channels | View | ||||
| Add/Edit/Delete |
The Alerts feature helps Service Experience Insights users improve service quality and user satisfaction through proactive performance monitoring, issue identification, and faster resolution.
The Service Experience Insights Alerts feature enables users to create threshold-based Alert Policies that continuously monitor the performance of agent-to-target paths. These policies trigger Alerts and Alert Notifications when the observed metrics violate the threshold for the duration of the event. Create Alert Policies to monitor latency, jitter, loss, HTTP target availability, WiFi signal strength, and agent connectivity. Configure the trigger conditions and notification channels for Alerts triggered by the Alert Policy.
Alerts are stored in time series and listed in the Alerts table. Each Alert links to an Alert page that shows the threshold and the observed metrics before, during, and after the event—view by searching the Alerts table or clicking through from a notification.
Receive alerts for a single agent-to-target path or use Agent and Targets Groups to trigger alerts that identify issues specific to certain regions or network segments.
Subscribe to alerts via webhooks or email. Webhooks allow users to receive real-time notifications and trigger automated actions responding to an alert, such as populating a Slack channel. Subscribe to a webhook to receive a JSON file for alerts grouped by Alert Policy. Use webhooks with your existing systems to automate tasks like sending an SMS message or opening a ticket in a service management tool.
Key benefits:
Continuous monitoring: The feature enables users to create Alert Policies that continuously monitor the performance of agent-to-target paths, ensuring that issues are identified and addressed promptly.
Threshold-based alerts: Alert Policies trigger Alerts and Alert Notifications when observed metrics violate the threshold for the duration of the event. This helps to identify performance issues and take corrective actions proactively.
Multiple monitoring options: Users can create Alert Policies to monitor latency, jitter, loss, HTTP target availability, WiFi signal strength, and agent connectivity, providing comprehensive monitoring coverage.
Configurable triggers and notifications: Easily configure the trigger conditions and notification channels for Alerts triggered by the Alert Policy for specific use cases.
Group-based alerts: Users can receive alerts for a single agent-to-target path or use Agent and Targets Groups to trigger alerts that identify issues specific to certain regions or network segments.
Integration with existing systems: The feature allows users to subscribe to alerts via webhooks or email and integrate with their existing systems to automate tasks like sending an SMS message or opening a ticket in a service management tool.
Real-time notifications: Webhooks enable users to receive real-time notifications and trigger automated actions responding to an alert, such as populating a Slack channel, ensuring that issues are addressed promptly.
Use the Alerts Page to view active and recovered alerts, access detailed information about each alert, configure threshold-based Alert Policies, and set up email and webhook distributions for alert notifications.
The Alerts Dashboard is designed to be intuitive and user-friendly, allowing users to easily access the information and tools they need to monitor their network performance effectively.
The alerts dashboard contains three important functions located in the page tabs:
Alerts: View and search alerts that are triggering or resolved in the Alerts > Alerts tab.
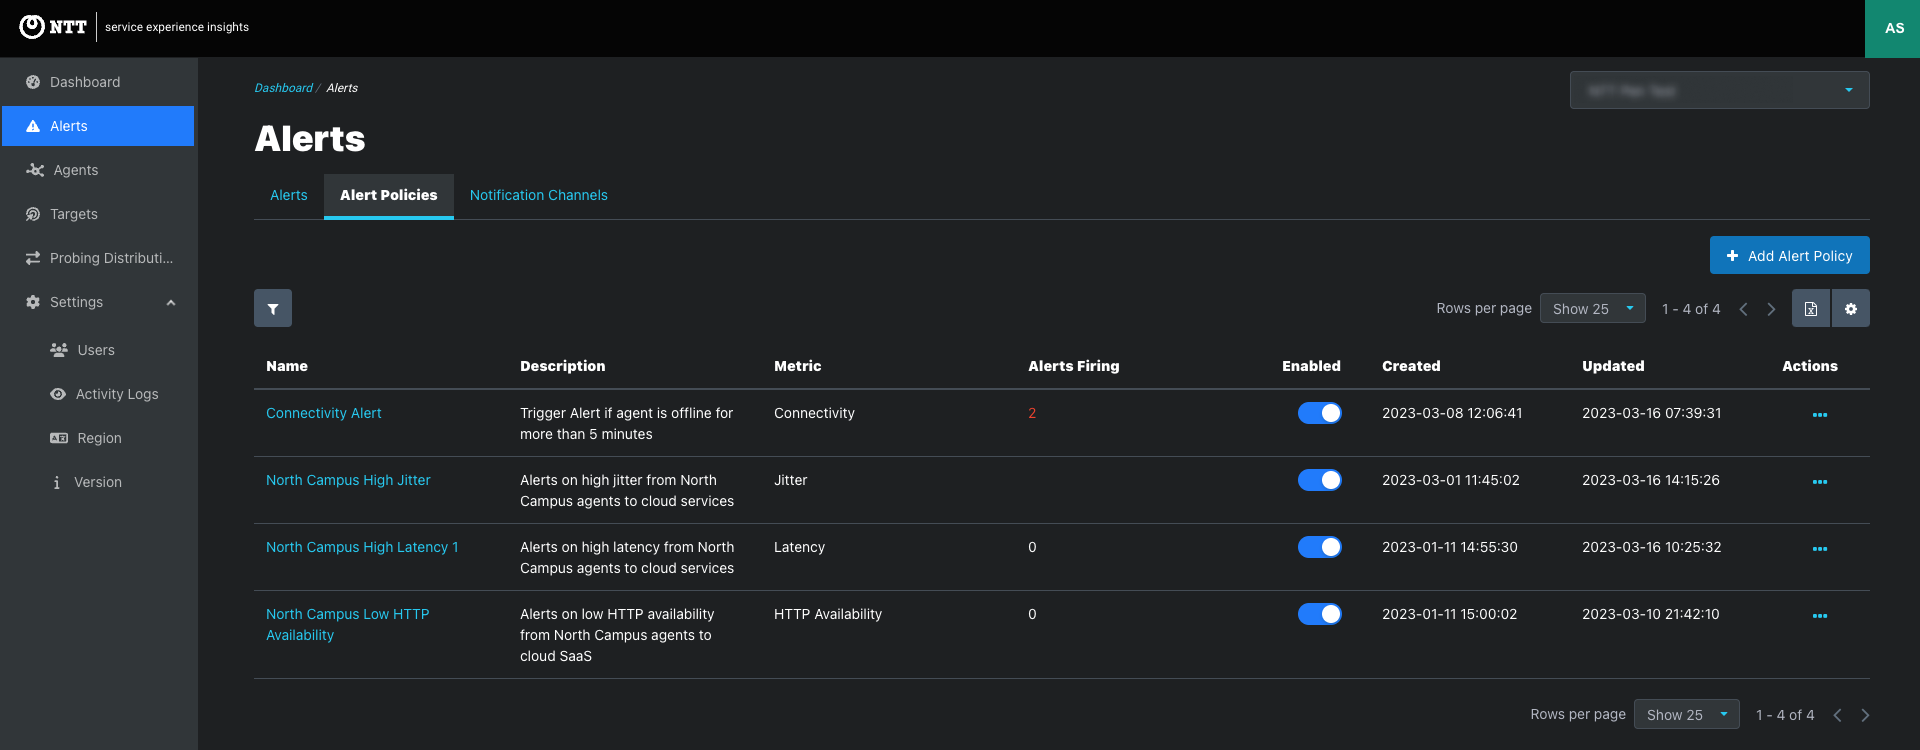
Alert Policies: Create Alert Policies and view alerts triggered by each Alert Policy in the Alerts > Alert Policies tab.
Notification Channels: Configure email distribution lists and webhook endpoints to receive alert notifications in the Alerts > Notification Channels tab.
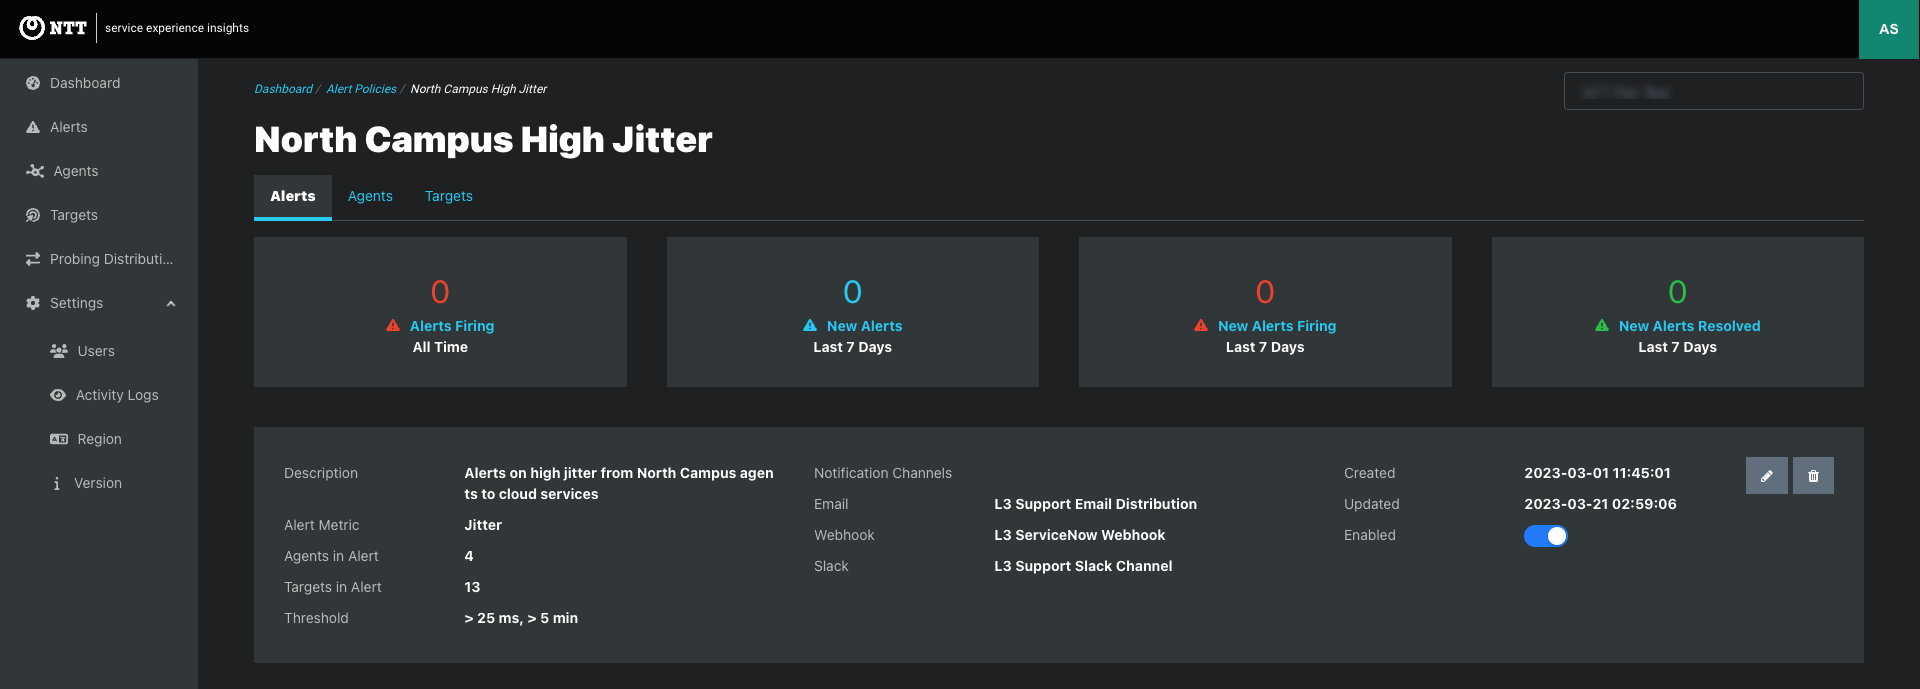
Alerts > Alerts tab: View and search alerts that are triggering or resolved.
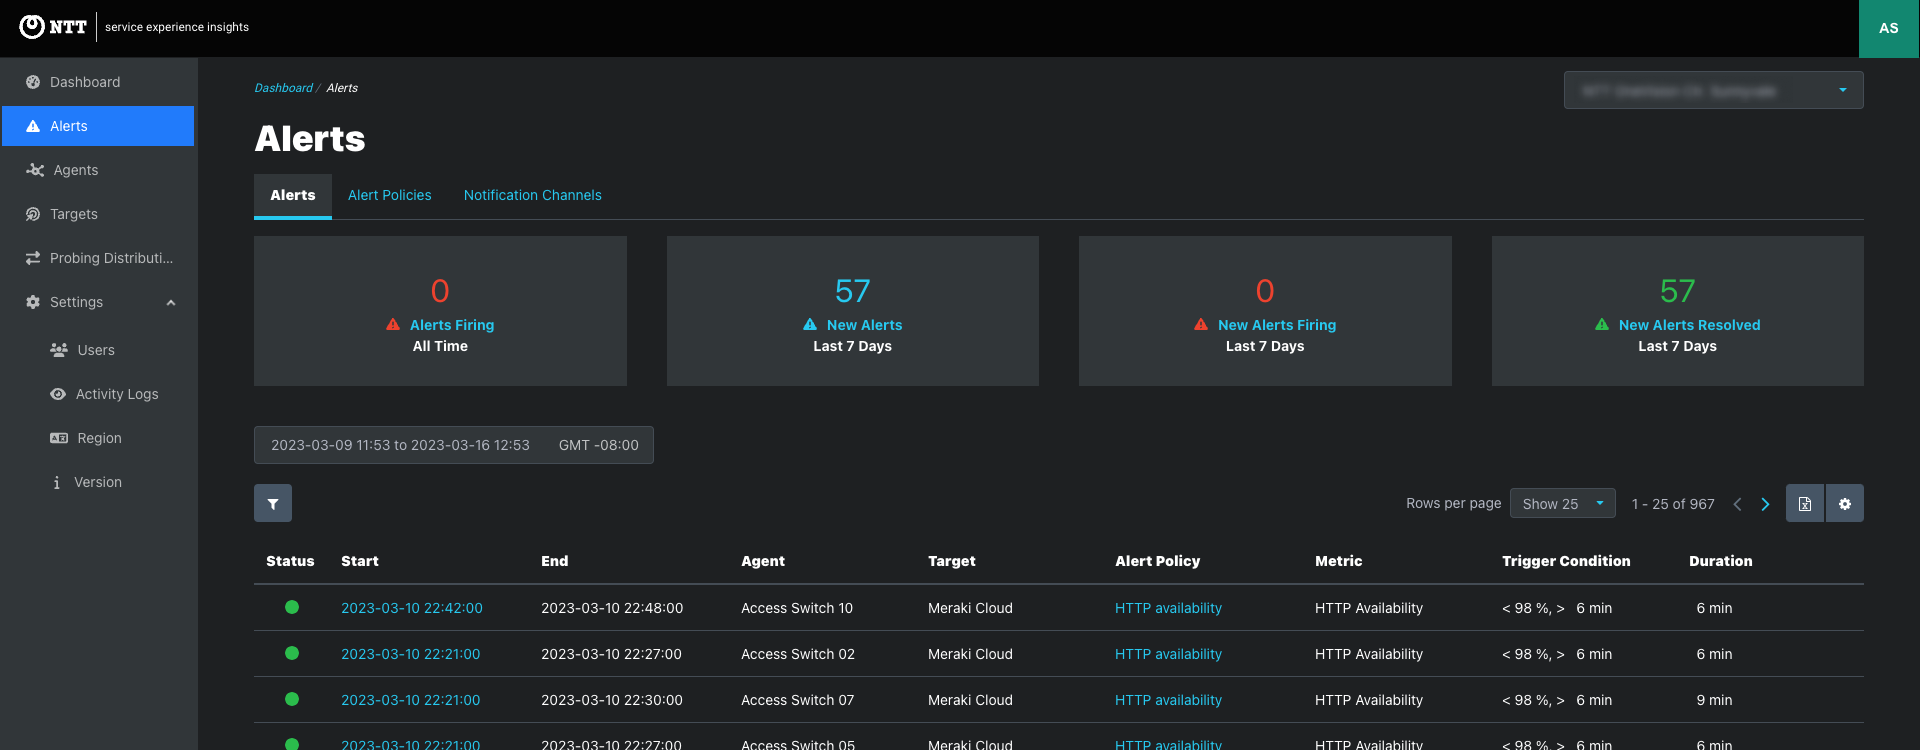
View and search alerts stored in the time series database.
Info panels at the top provide a summary of alerts. Click the link to sort the table to show the alerts summarized in the info panel.
Alerts Firing provides a count of all firing alerts.
New Alerts show a count of the alerts triggered in the last seven days.
New Firing Alerts counts alerts that began firing within the last week and have not yet recovered.
New Alerts Resolved gives a count of the alerts that have recovered in the past seven days.
Alerts are listed chronologically, with the most recent listed first.
Sort alerts by date and time.
Filter alerts by status. Is Firing or Resolved.
Click the Start date link to view the Alert Summary.
Click the Alert Policy name link to view the Alert Policy that triggered the alert and a list of Alerts for that Policy.
Table sorting
Start is the only sortable column in the Alerts pages.
Due to the volume of alerts, sorting is not practical in most projects and has been removed to improve page performance.
Search is not supported for the same reason.
Time range and filters are provided in each table.
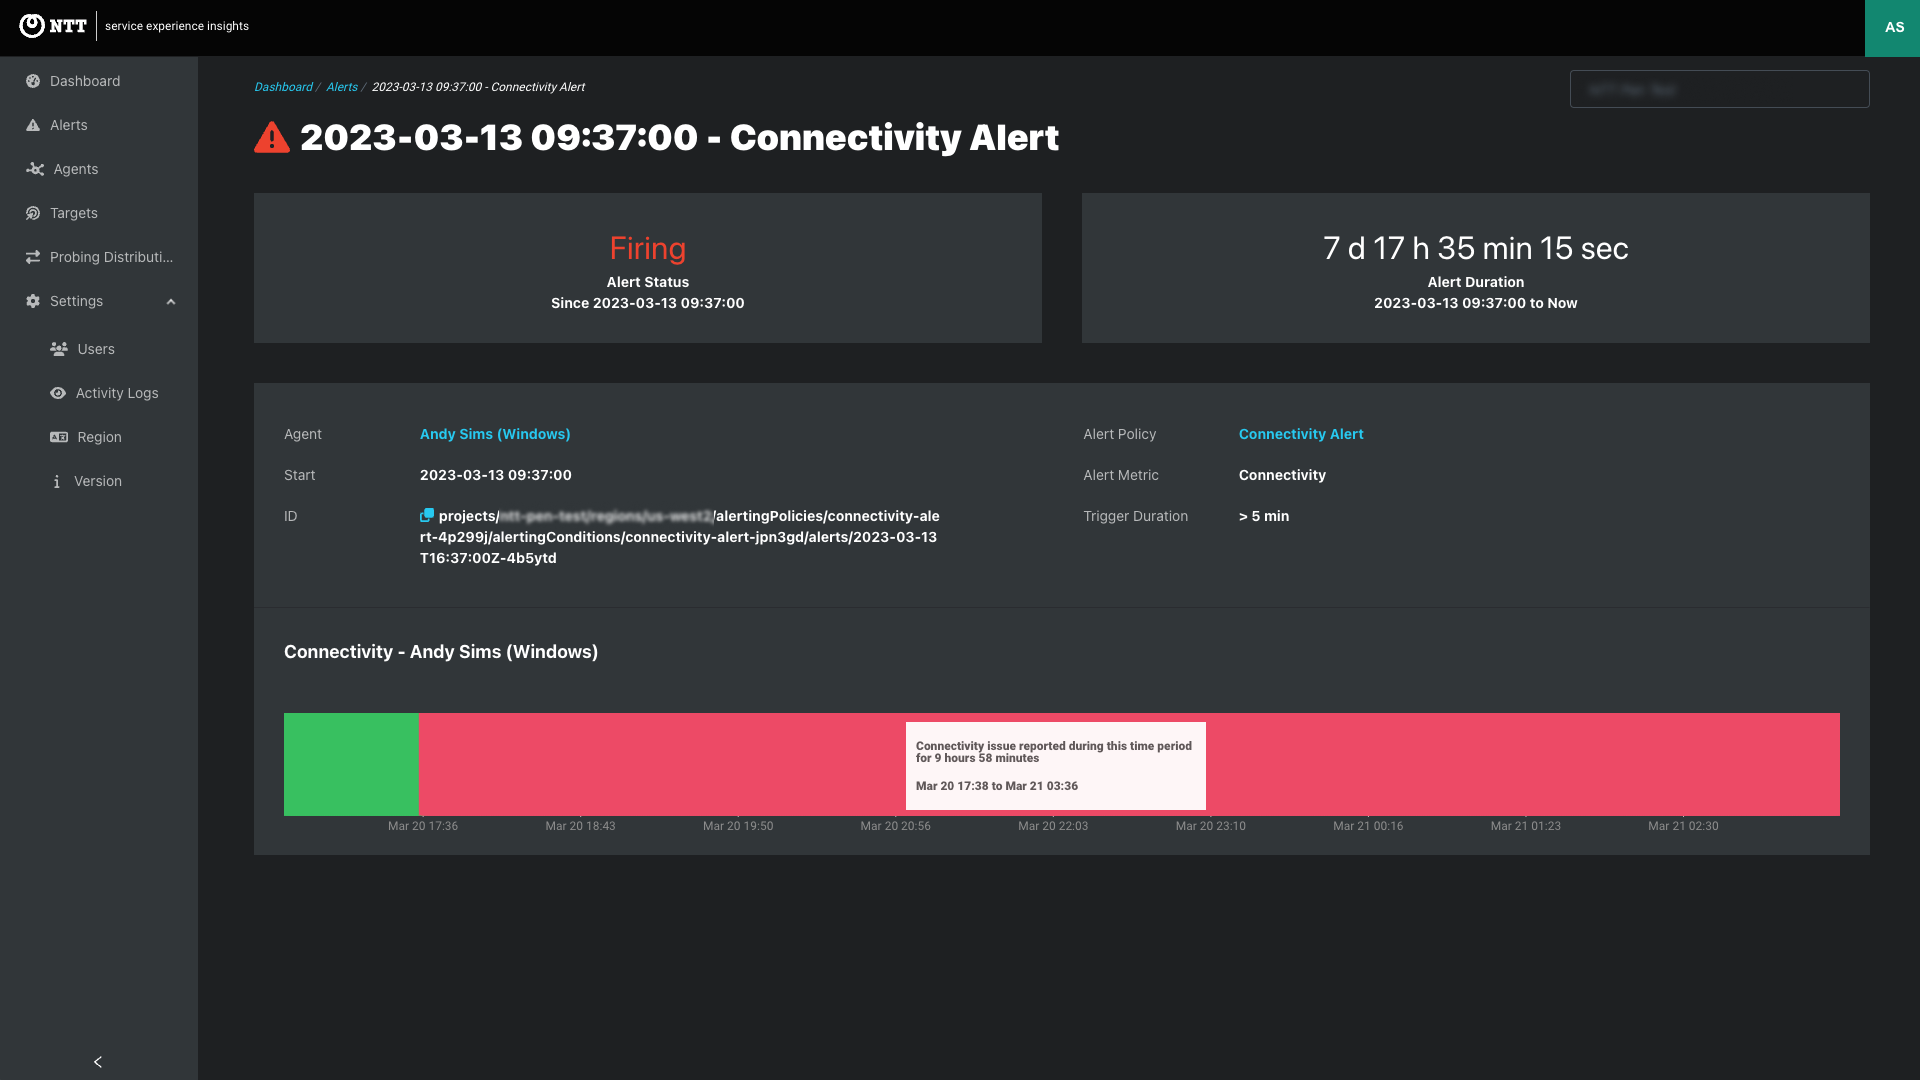
Click through from the alerts list or from an Alert Notification to view a summary of each alert.
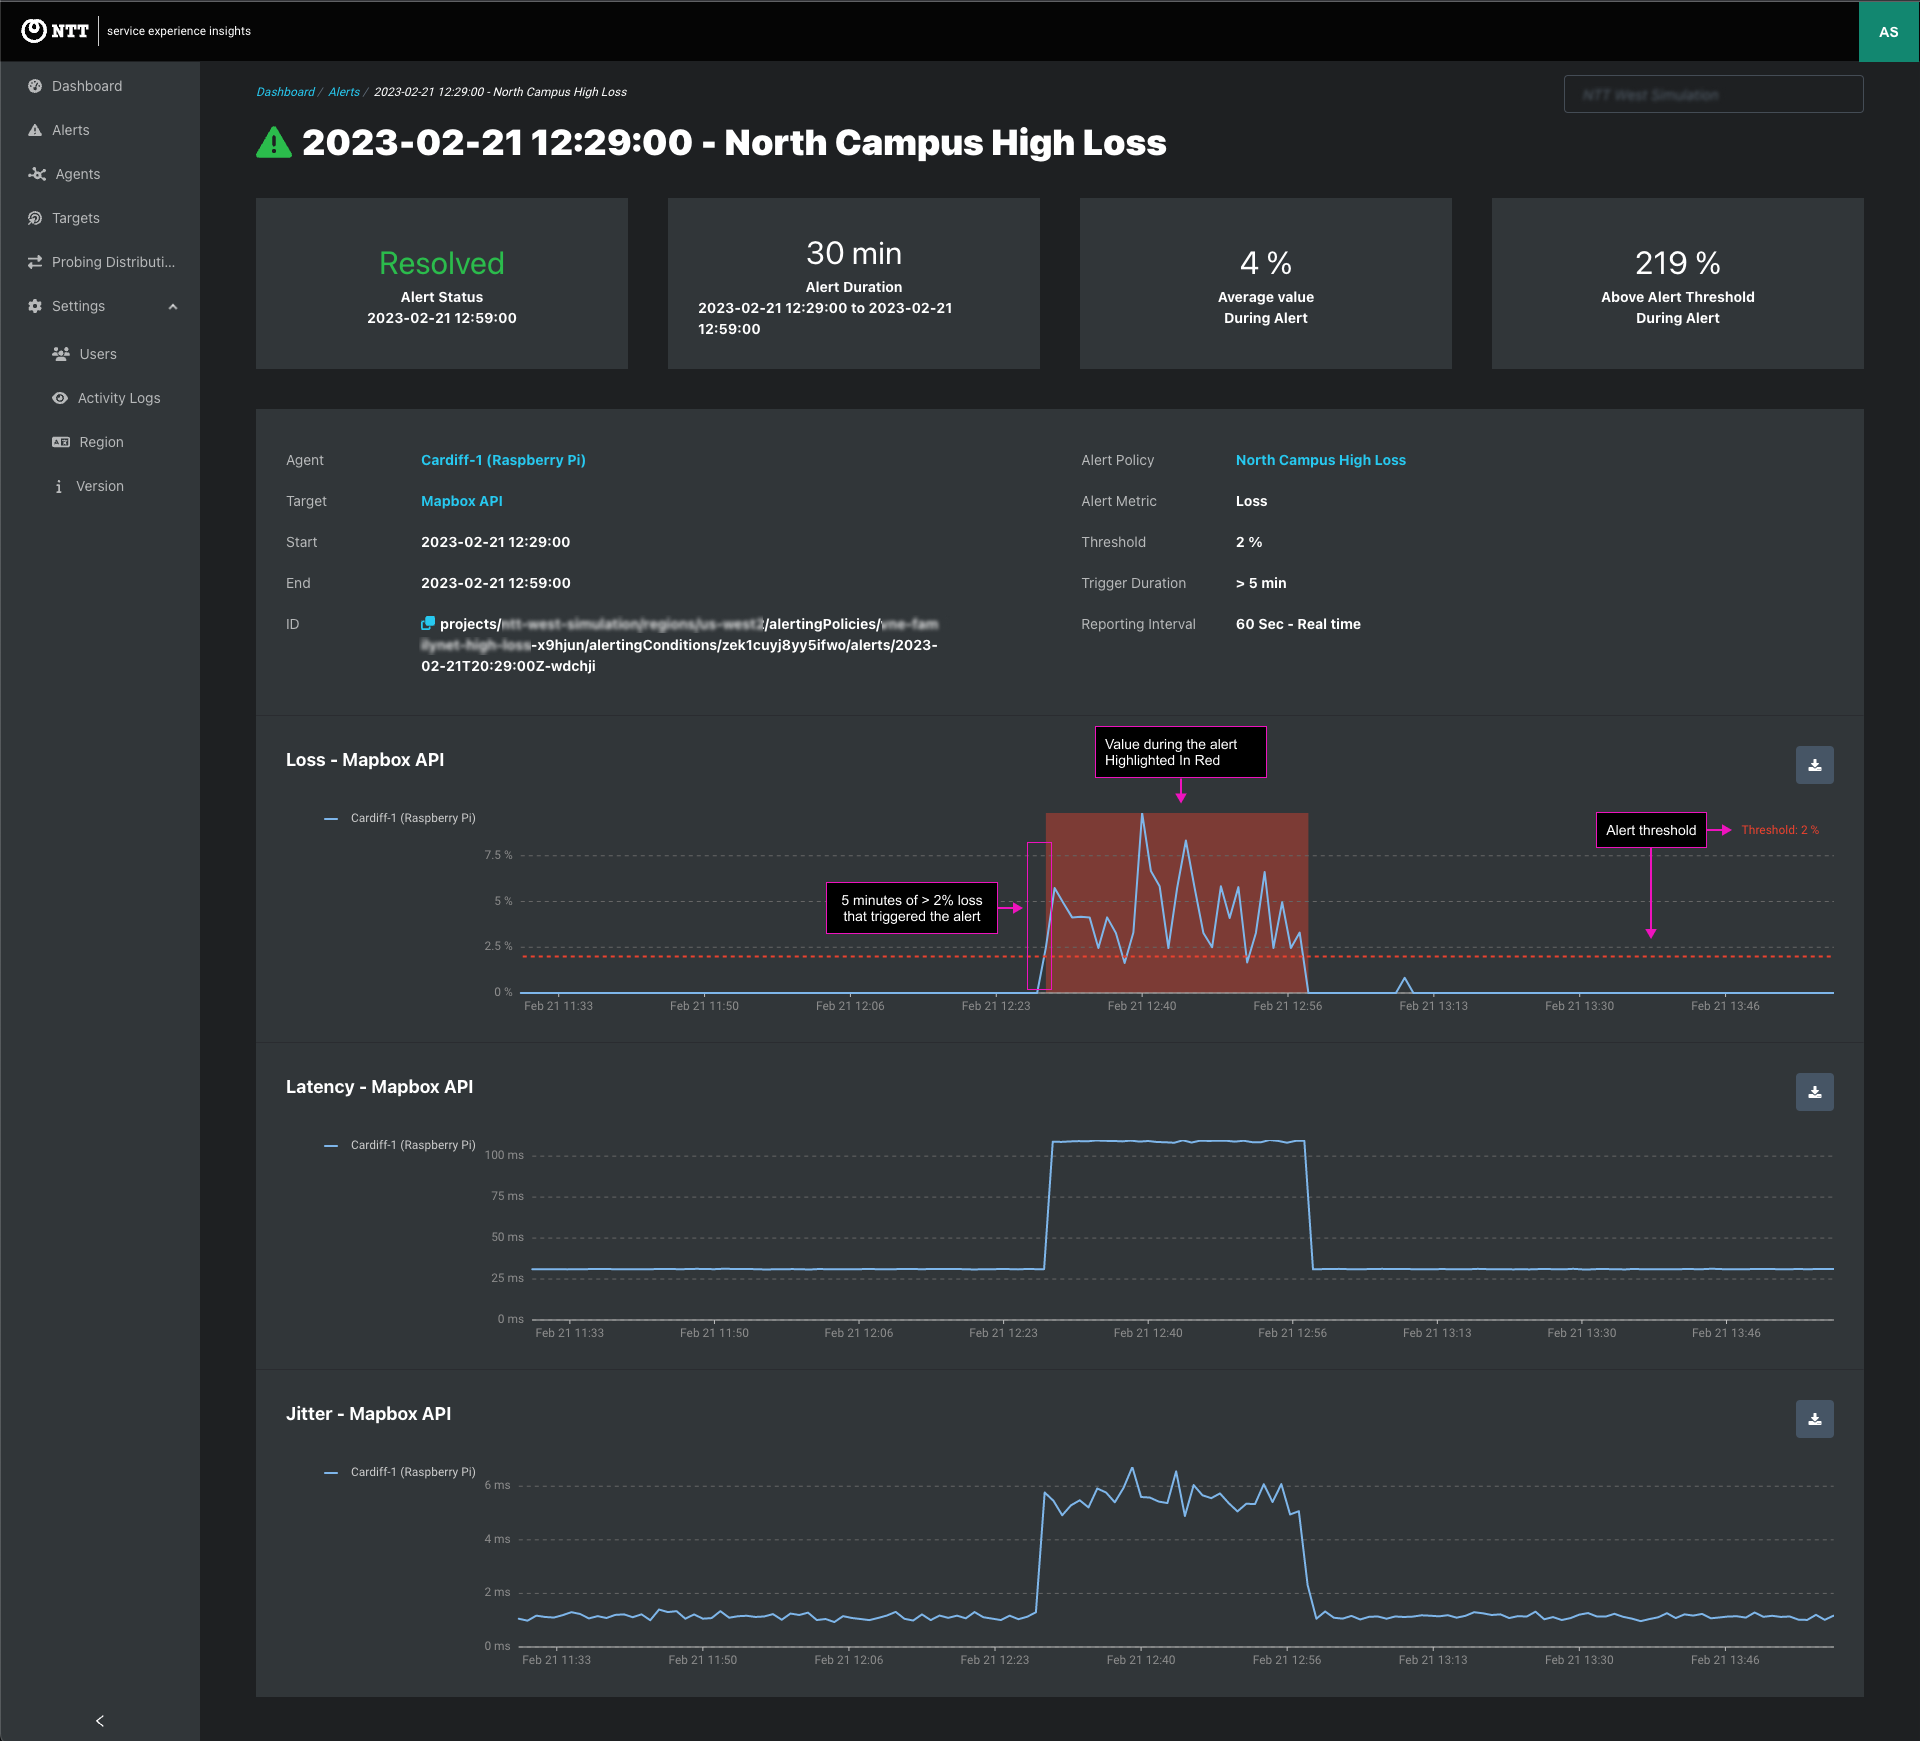
Alert summaries provide metrics and context about the monitored event that triggered the alert.
Firing Alert - Example of Connectivity Alert Firing for nine hours
Recovered Alert - Example of Loss Alert
Alert Policies are rules that define when user-defined threshold-based alerts are triggered. Set threshold metrics such as latency, packet loss, and agent connectivity. When the observed metrics violate the thresholds, an alert is generated to notify the user of the anomaly.
View and create customizable alerting policies that define when threshold-based alert triggers and notifications routing.
Alerts > Alert Policies tab: Create Alert Policies and view alerts triggered by each Alert Policy.
Alert Policy Configuration
| Name & Description | Protocol | Selected Agents | Selected Targets | Trigger Conditions | Notification Channels |
|---|---|---|---|---|---|
| Name and describe the Alert Policy | Choose one for each Alert Policy
| Assign Agents
| Assign Targets
|
|
|
| Example | |||||
| Loss | Access Switch agent group | SaaS target group | Greater Than 2% for more than 5 minutes, reported every 60 seconds |
|
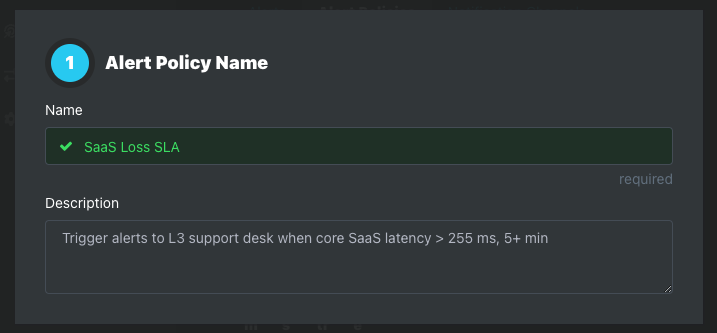
To create an Alert Policy, go to the Alerts > Alert Policies tab. Click the Add Alert Policy button to open the Add Alert Policies modal.
Complete these steps to begin triggering threshold-based alerts and receiving alert notifications.
Step 1: Name and Description
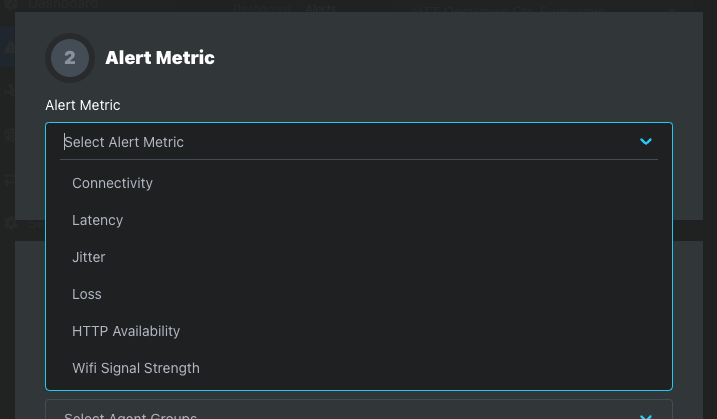
Step 2: Alert Metric
| Available Metrics | |
|---|---|
| Connectivity | Agent down detection - no connectivity between the agent and SEI controller. |
| Latency | The time it takes for a packet of data to travel from its source to its destination. (milliseconds) |
| Jitter | The variation in the latency of individual packets in a data stream. (milliseconds) |
| Loss | The failure of one or more transmitted packets to arrive at their destination. (percentage of failed packets) |
| HTTP Availability | The availability of a web server or other network resource. (percentage of successful packets) |
| WiFi Signal Strength | A measure of the strength of the wireless signal from a WiFi router or access point. Scale 0% to 100%. 0%, no signal - 100%, no detected signal degradation. |
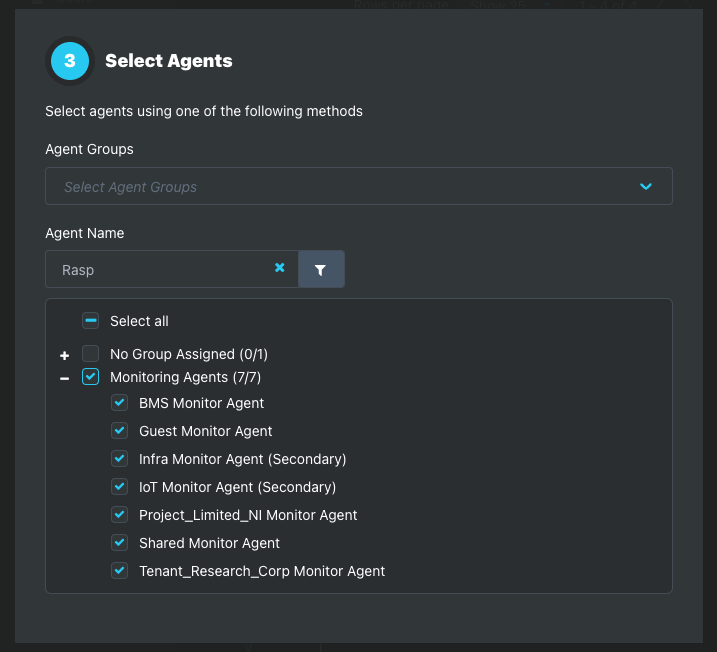
Step 3: Select Agents
Add agents to the Alert Policy using one of the following methods. Agent selection methods cannot be combined.
Agent Groups dropdown
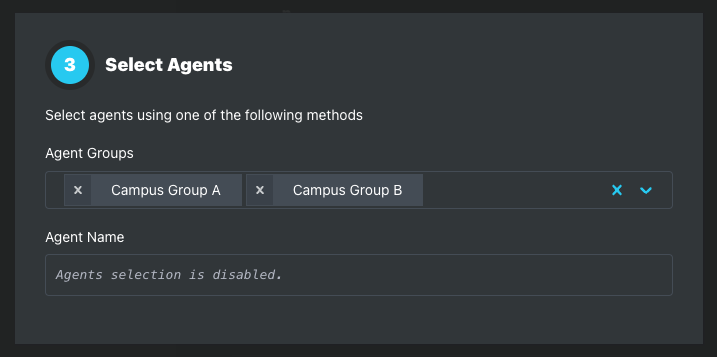
Agent Name
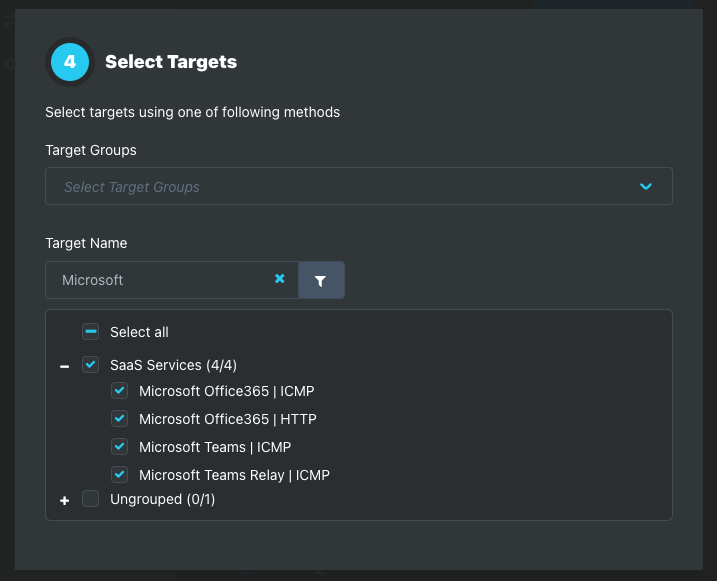
Step 4: Select Targets
Add targets to the Alert Policy using one of the following methods. Target selection methods cannot be combined.
Target Groups dropdown
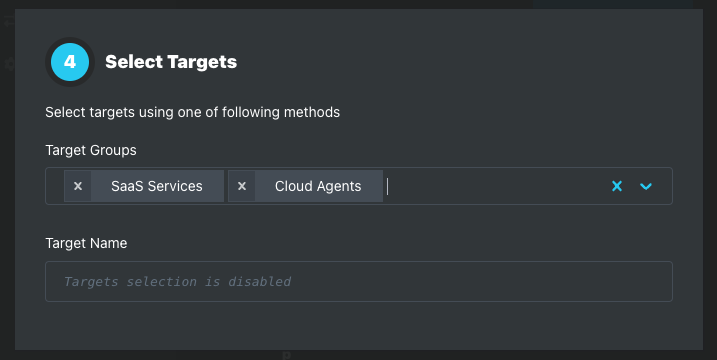
Target Name
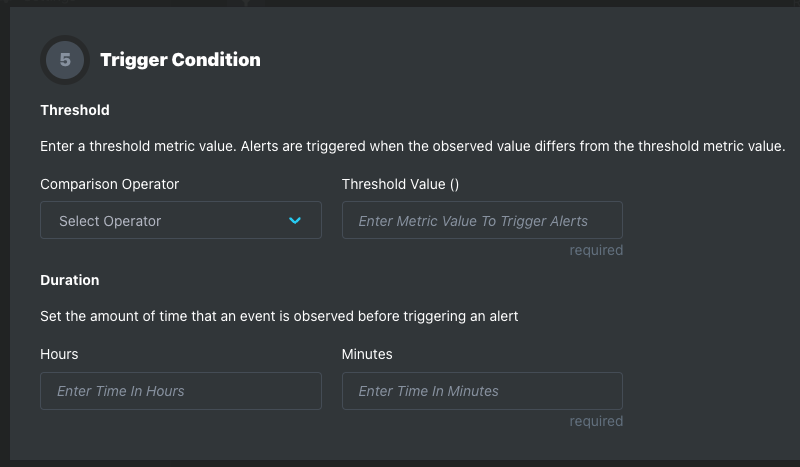
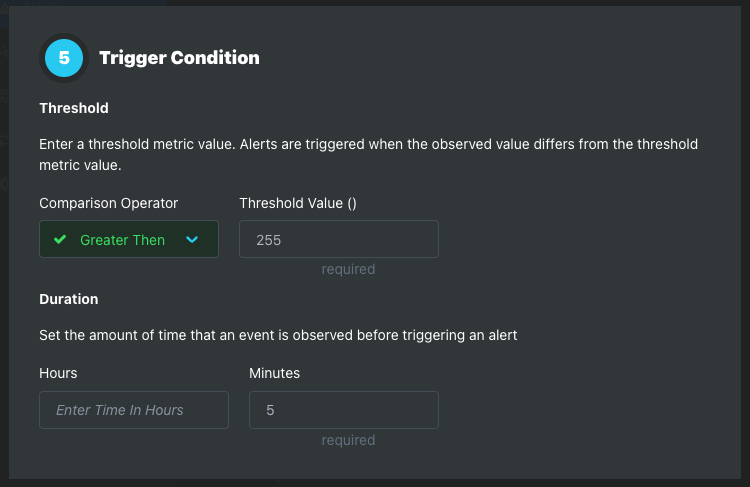
Step 5: Trigger Conditions
Threshold
| Threshold Metric | Comparison Operator | Threshold Value |
|---|---|---|
| Latency | Greater Than, Less Than - Defaults to Greater Than | Milliseconds (ms) - ex: 150ms - no default |
| Jitter | Greater Than, Less Than - Defaults to Greater Than | Milliseconds (ms) - ex: 75ms - no default |
| Loss | Greater Than, Less Than - Defaults to Greater Than | Percent(%) - ex: 2% - no default |
| HTTP Availability | Greater Than, Less Than - Defaults to Less Than | Percent(%) - ex: 98% no default |
| WiFI Signal Strength | Greater Than, Less Than - Defaults to Less Than | Percent(%) - ex: 90% - no default |
| Connectivity (Agent Status) | Equals, Not Equals - Defaults to Equals | On, Off - Defaults to Off |
Duration
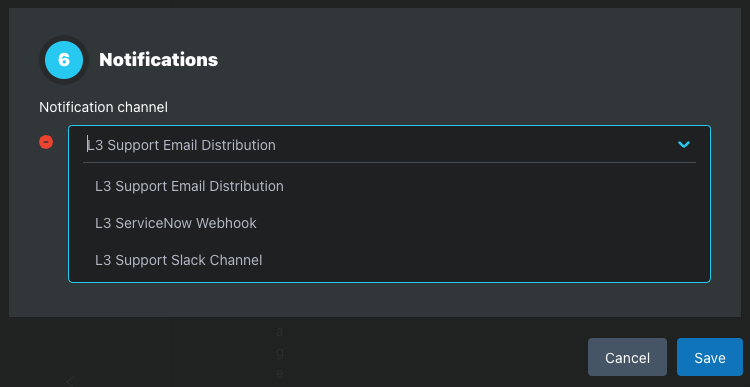
Step 6: Notification Channels
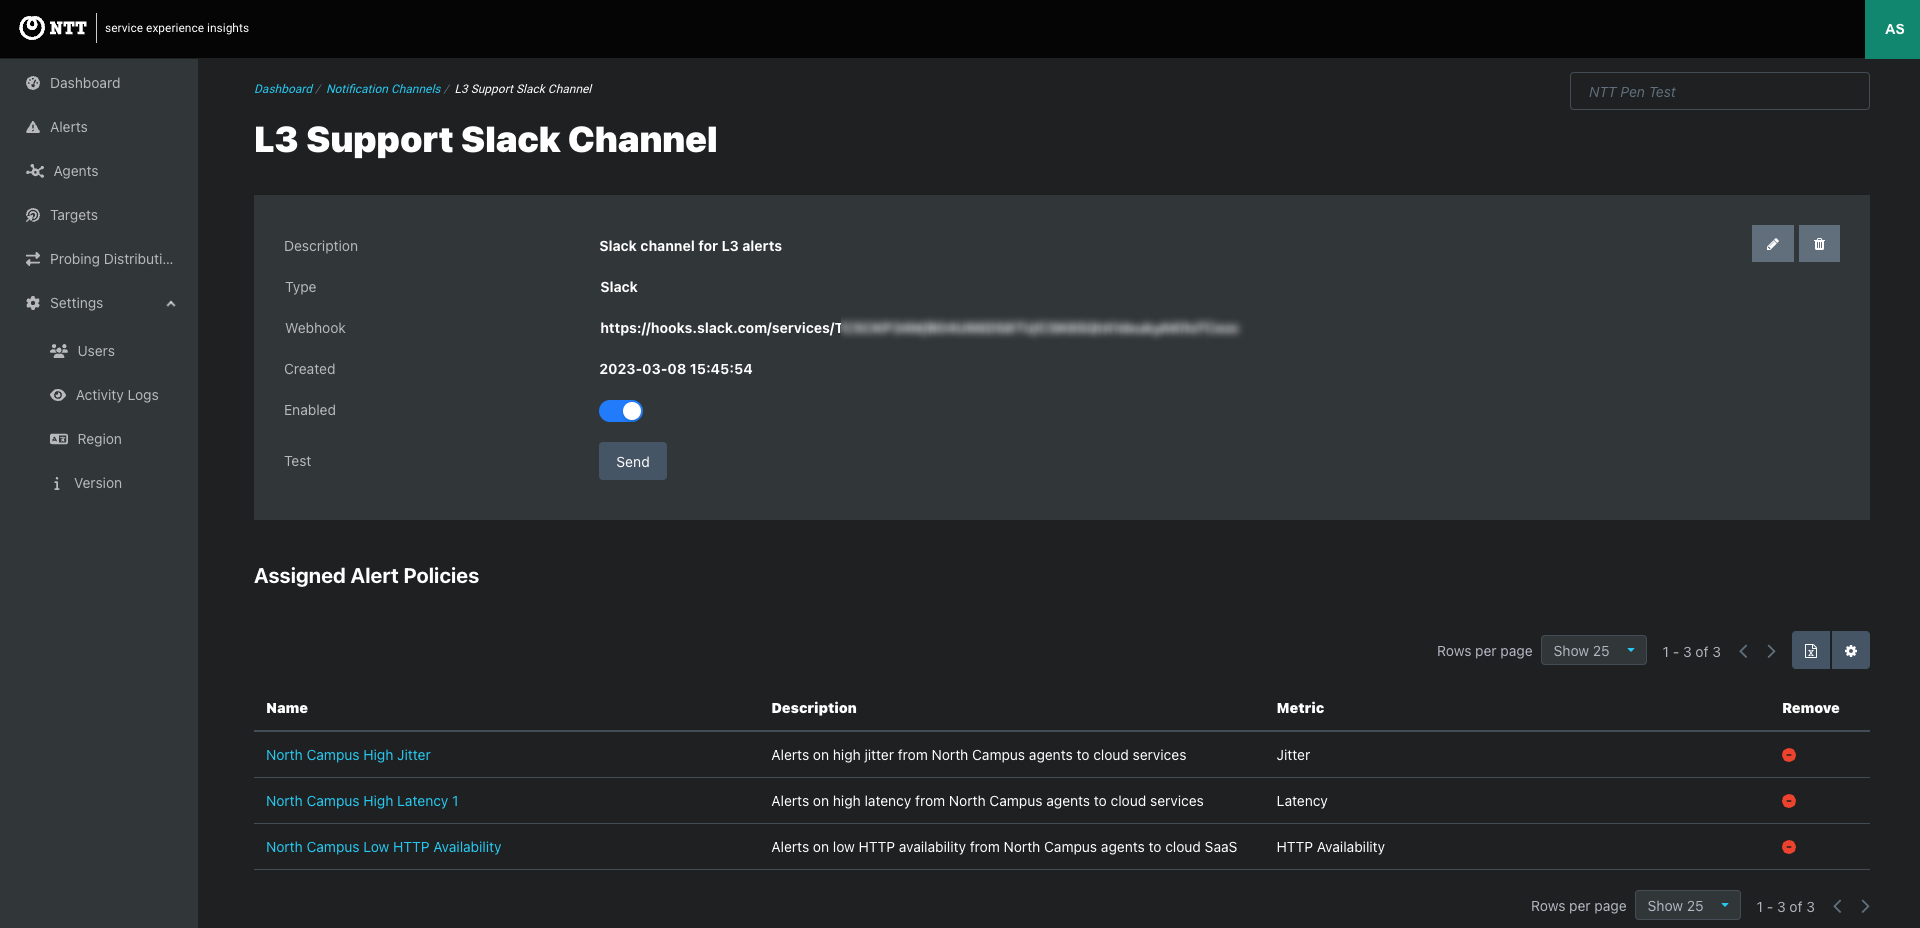
Notification Channels are email distribution lists and webhook endpoints to receive Alert Notifications when the Alert Policy triggers alerts.
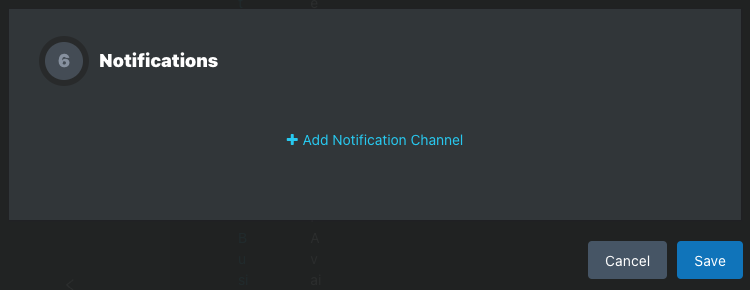
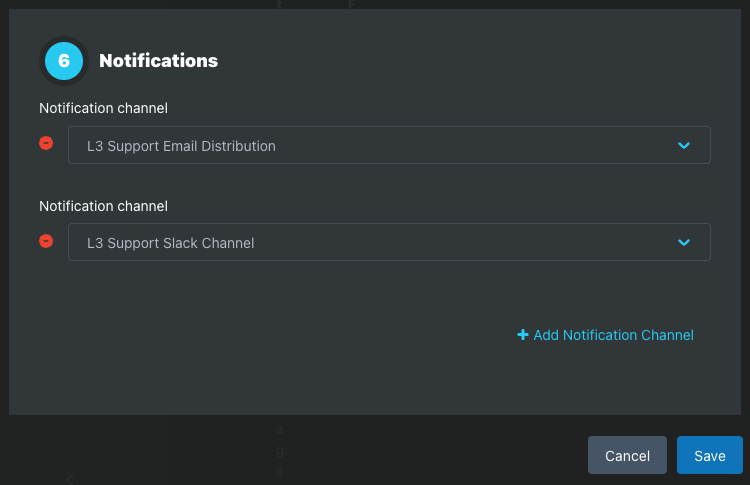
Once added to an Alert Policy, the Notification Channels is listed on the Alert Policy page.
Notification channels are email distribution lists and webhook endpoints that receive Alert Notifications when an Alert Policy triggers alerts.
Email, Slack, and custom Webhooks are supported.
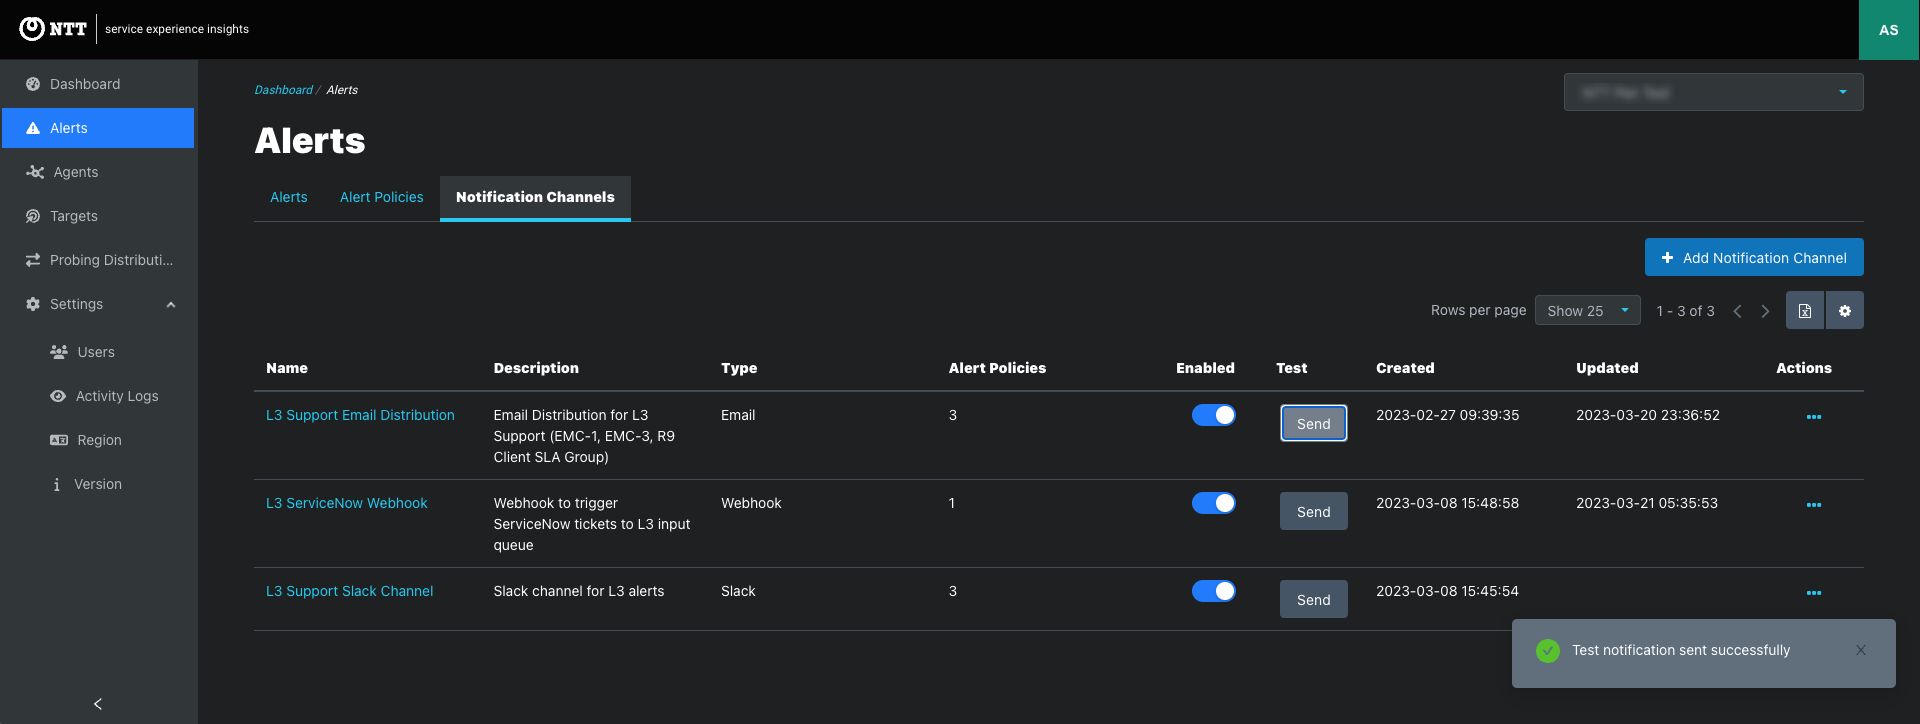
Alerts > Notification Channels tab: Create Notification Channels and view and edit existing Notification channels that are available to be added to Alert Policies.
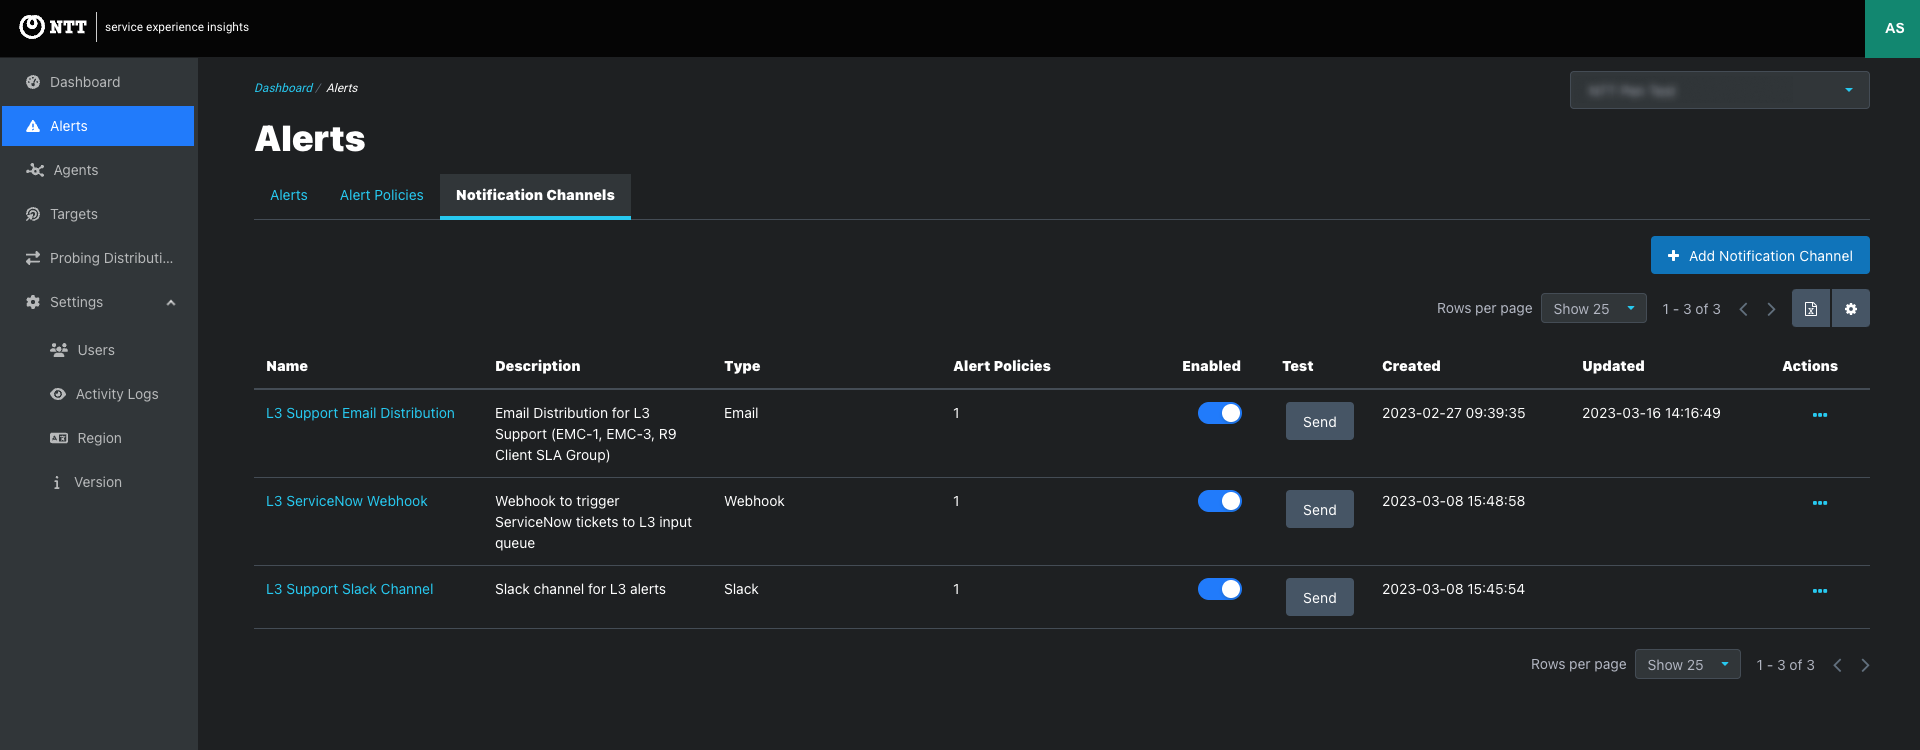
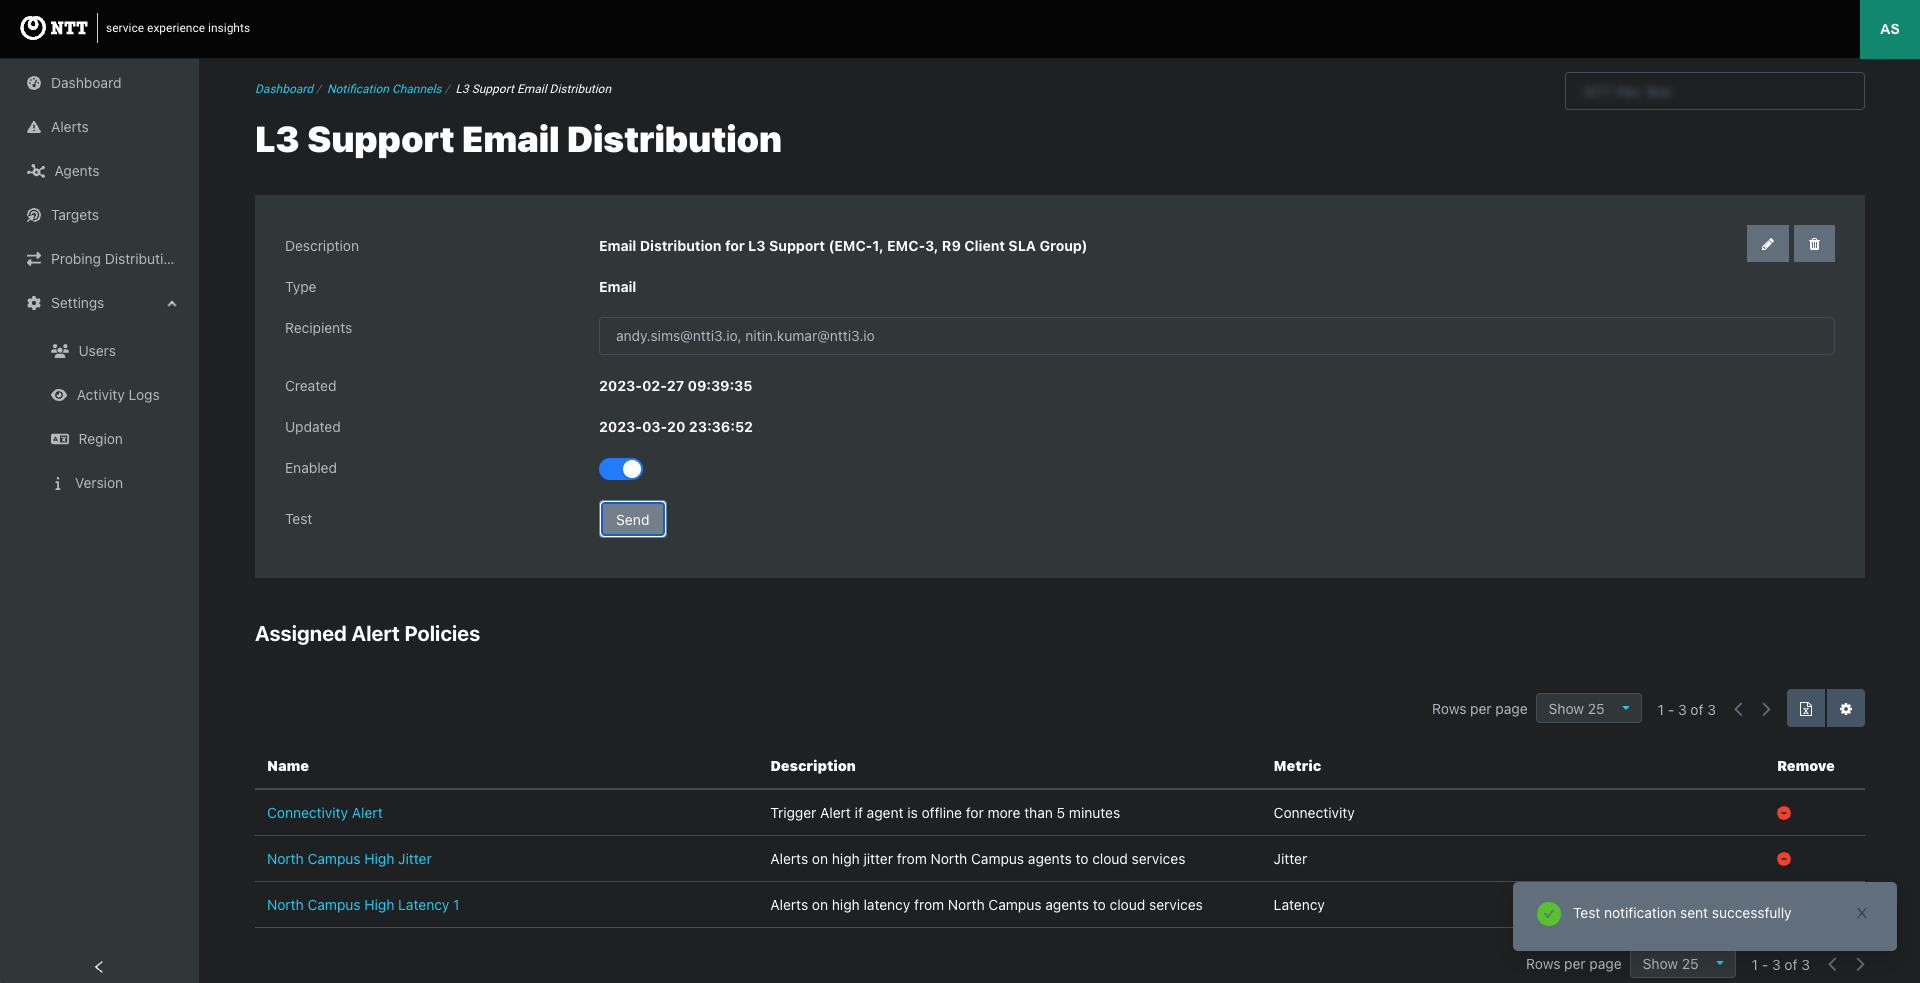
Click the Notification Channel link to view the notification page that lists the assigned emails or webhooks and the Alert Policies assigned to the Notification Channel.
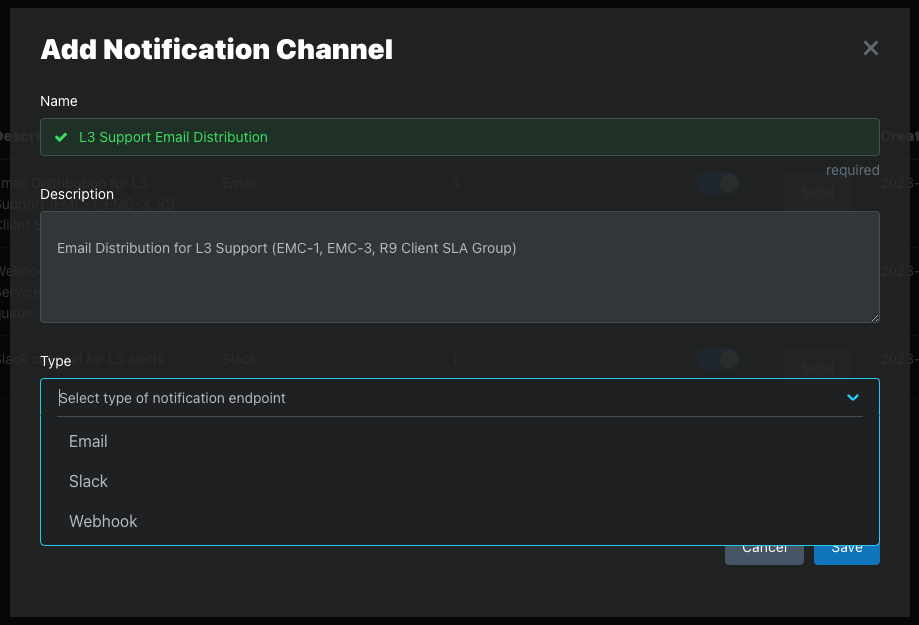
To create a Notification Channel, go to the Alerts > Notification Channels tab. Click the Add Notification Channel button to open the Add Notification Channel modal.
Complete these steps to create a Notification Channel that can be added to any Alert Policy.
Step 1: Name and Description
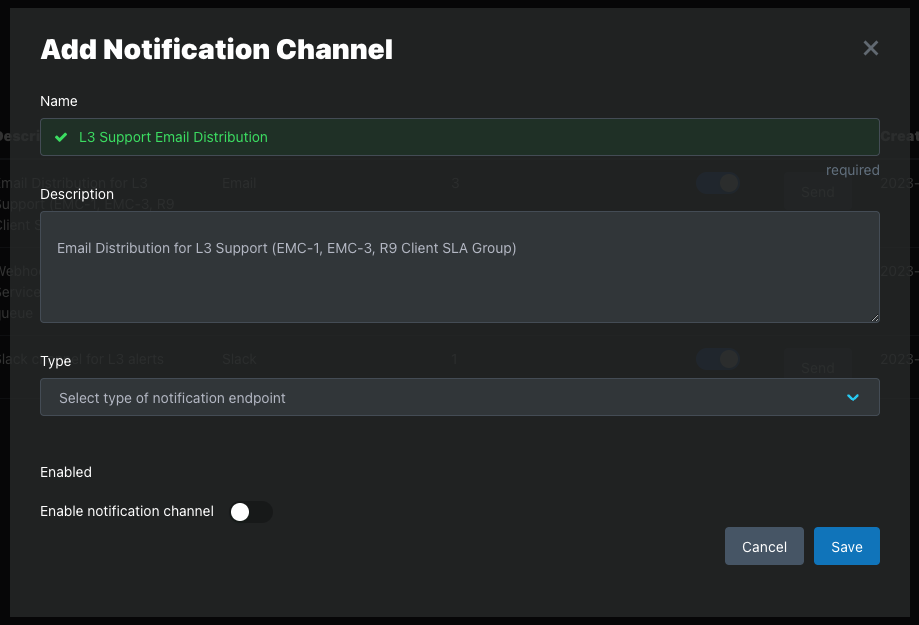
Step 2: Select Type
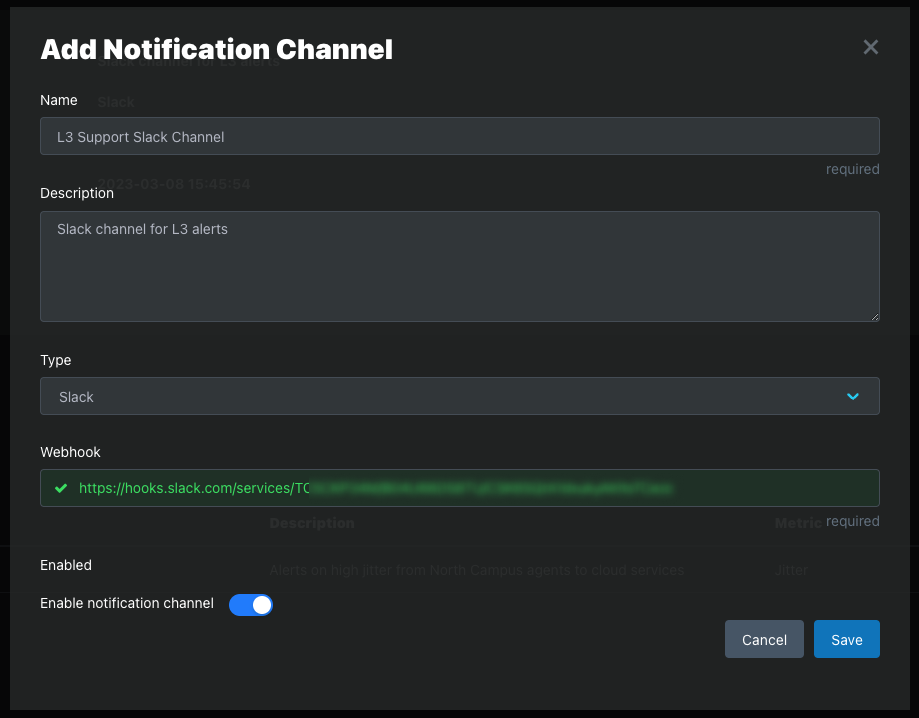
Slack
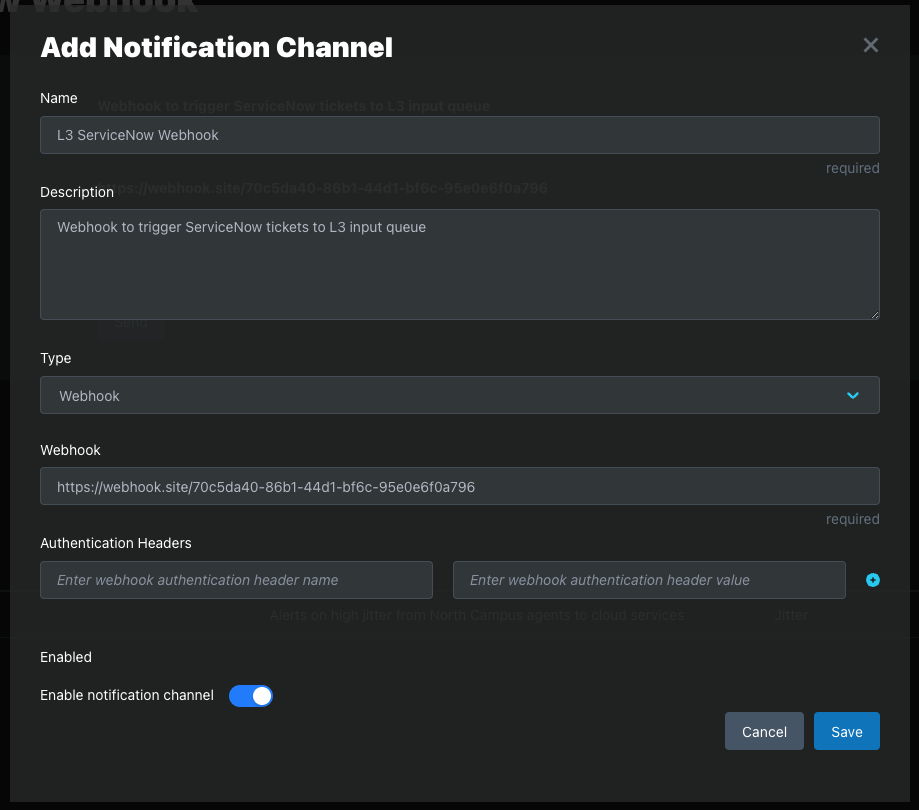
Webhook
Common JSON Parameters
| Name | Format | Description |
|---|---|---|
| languageCode | string | Alert Notification language, “ja-jp” or “en-us” |
| controllerDomain | string | Used to build links to Dashboard, if “dashboard.edgeLQ.com”, root url is https://dashboard.insights.edgelq.com/ |
| alertingPolicy.id | string | Used to build links to Dashboard, /alert?policyId={policyId} |
| alertingCondition.id | string | Used to build links to Dashboard, &conditionId=<{conditionId} |
| alerts.id | string | Used to build links to Dashboard, &alertId={alerts.id} |
| projectId | string | Used to build links to Dashboard, &scope=projects/{projectId} |
| notification.state.alertsLifetime.startTime | string | Time alert started (if firing) |
| notification.state.alertsLifetime.updateTime | string | Time alert recovered (if resolved) |
| events.state | string | “isFiring:” true or false - (false equal recovered) |
| alerts.monitoredResource.labels.probe_id | string | name of agent |
Testing Notification Channels
Notification Channels can be tested by clicking the Send button on the Notifications tab or in a Notification Page.
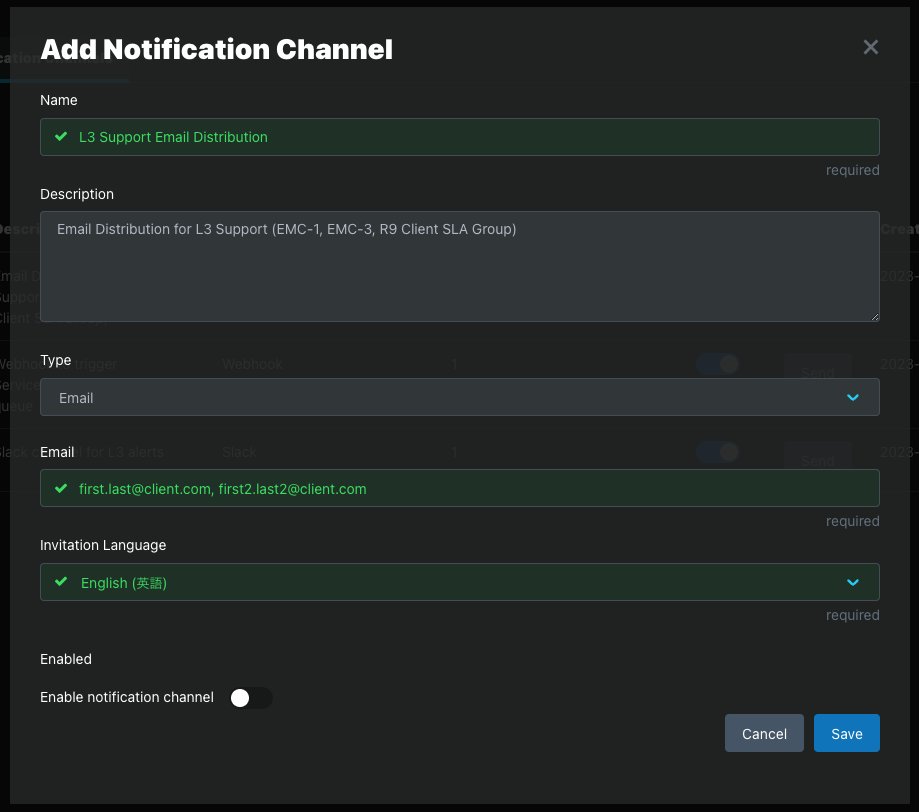
Email Notification Channels
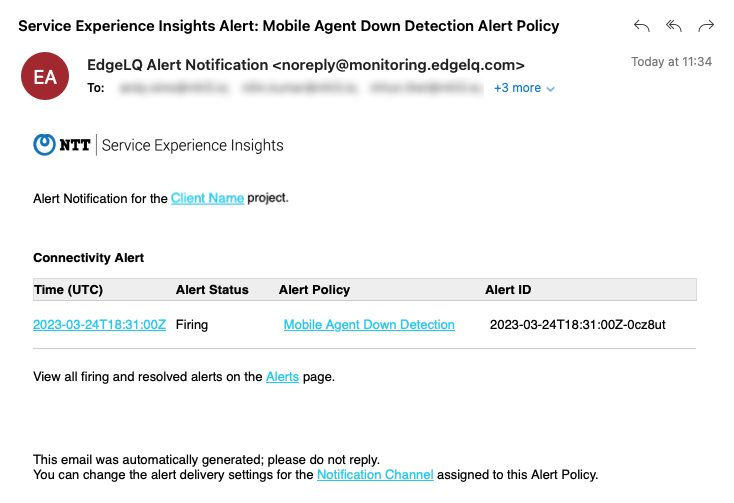
Email Alert Notifications are sent when alerts start firing and again when alerts are resolved.
Alert emails show all alerts for an alert policy every two minutes. Typically, an alert message will contain a single alert, but many could be listed.