en-US

Product Overview


Comprehensive service availability monitoring

Visibility of end-user experience over networks is challenging, particularly as applications are further distributed.

Click to expand

  • Client network infrastructure is available and functioning. However, end-users are complaining of slowness and an inability to access critical business services.
  • As critical business services move and change in line with a client’s digital transformation agenda, ensuring end-users have a positive experience is paramount.
  • IT teams need greater visibility into how users are experiencing business-critical applications and services, particularly as they move to SaaS and Cloud.


Monitoring solutions in the market today

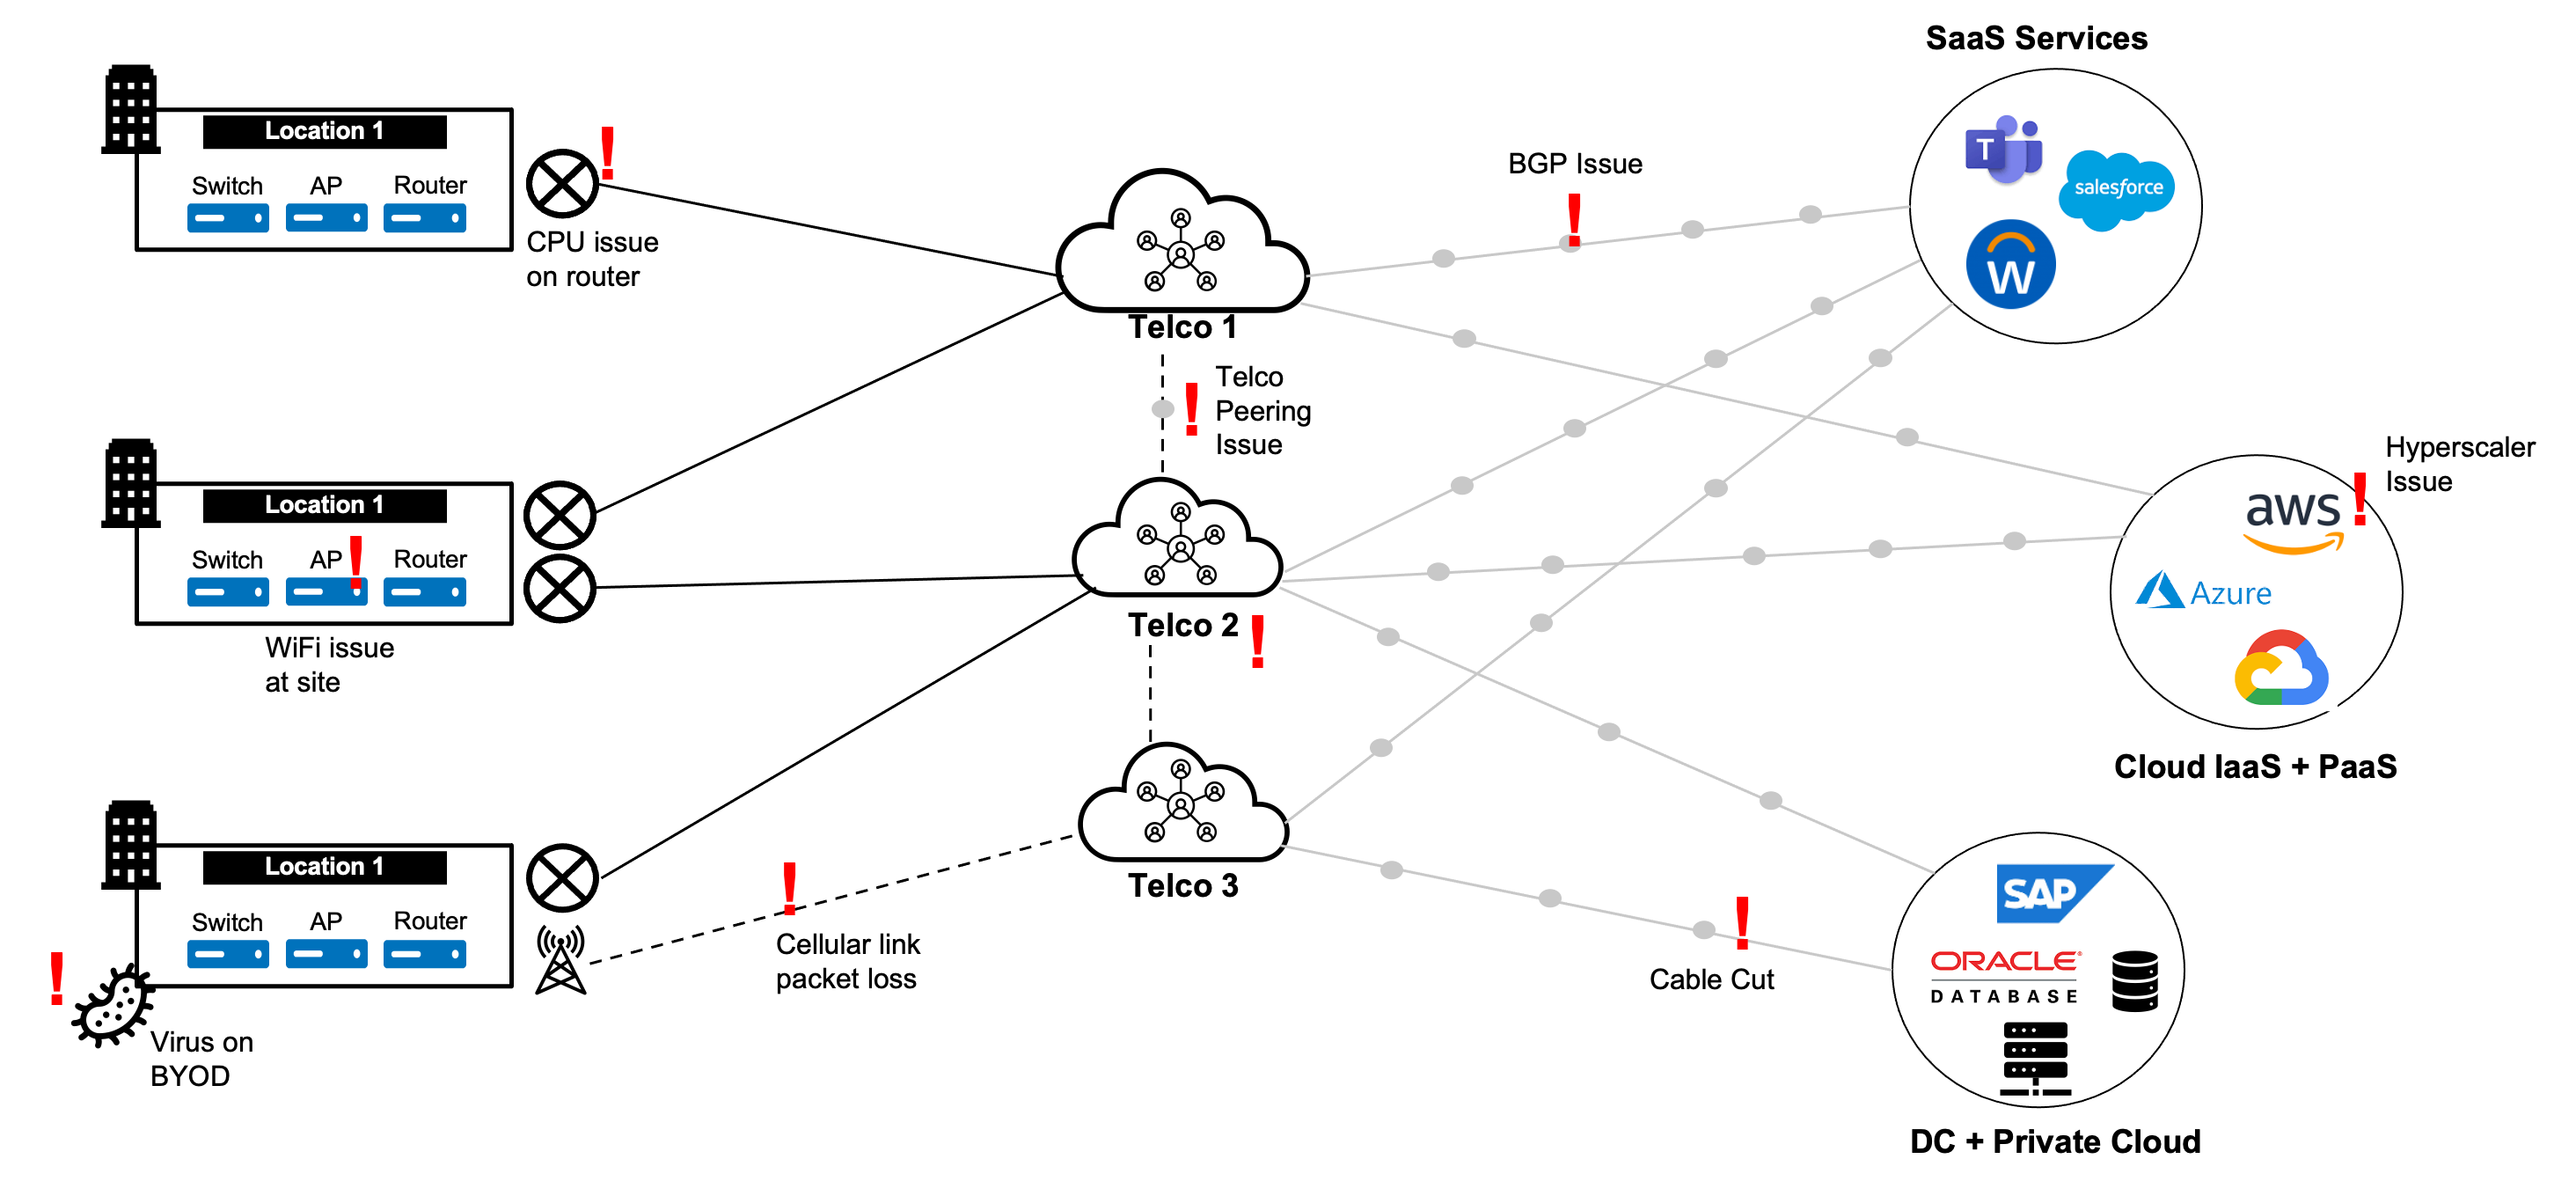
Networks’ current and future state relies on a better approach to network observability and intelligence.

There are many network observability products, but not enough insight. Why?


Technology Specific Monitoring
Vendors provide tooling to monitor and alert on their own technology – why do I need anything else?
  • Vendor tools are good for monitoring their own technology stack, however, they cannot see beyond the boundaries of that technology. In a multi-vendor environment, you end up with multiple tools and issues with handoff between technologies
  • Often the ability to tune events and alerting in vendor tools is very limited
Open Source Aggregation Tools
There is a number of DIY approaches to network and infrastructure monitoring available – why would I pay?
  • Building, tuning, and maintaining an open-source monitoring tool is a non-trivial task. Doubly so when you look at reporting, analytics, and visualization of data. Is your core business building and maintaining monitoring tools?
  • Extending open source tools to new technologies is also a non-trivial task – do you have the right people to do this?
Third Party Overlay Monitoring Services
Overlay monitoring solutions can provide additional visibility into user experience but come with limitations.
  • Third-party overlay monitoring tools provide visibility into how end users experience accessing applications over the network
  • Commercial models, choke points, and bandwidth limits mean these solutions aren't always a good fit
  • Correlating data between the overlay monitoring tool and the network vendor tooling can be challenging

NTT’s Approach - Service Experience Insights

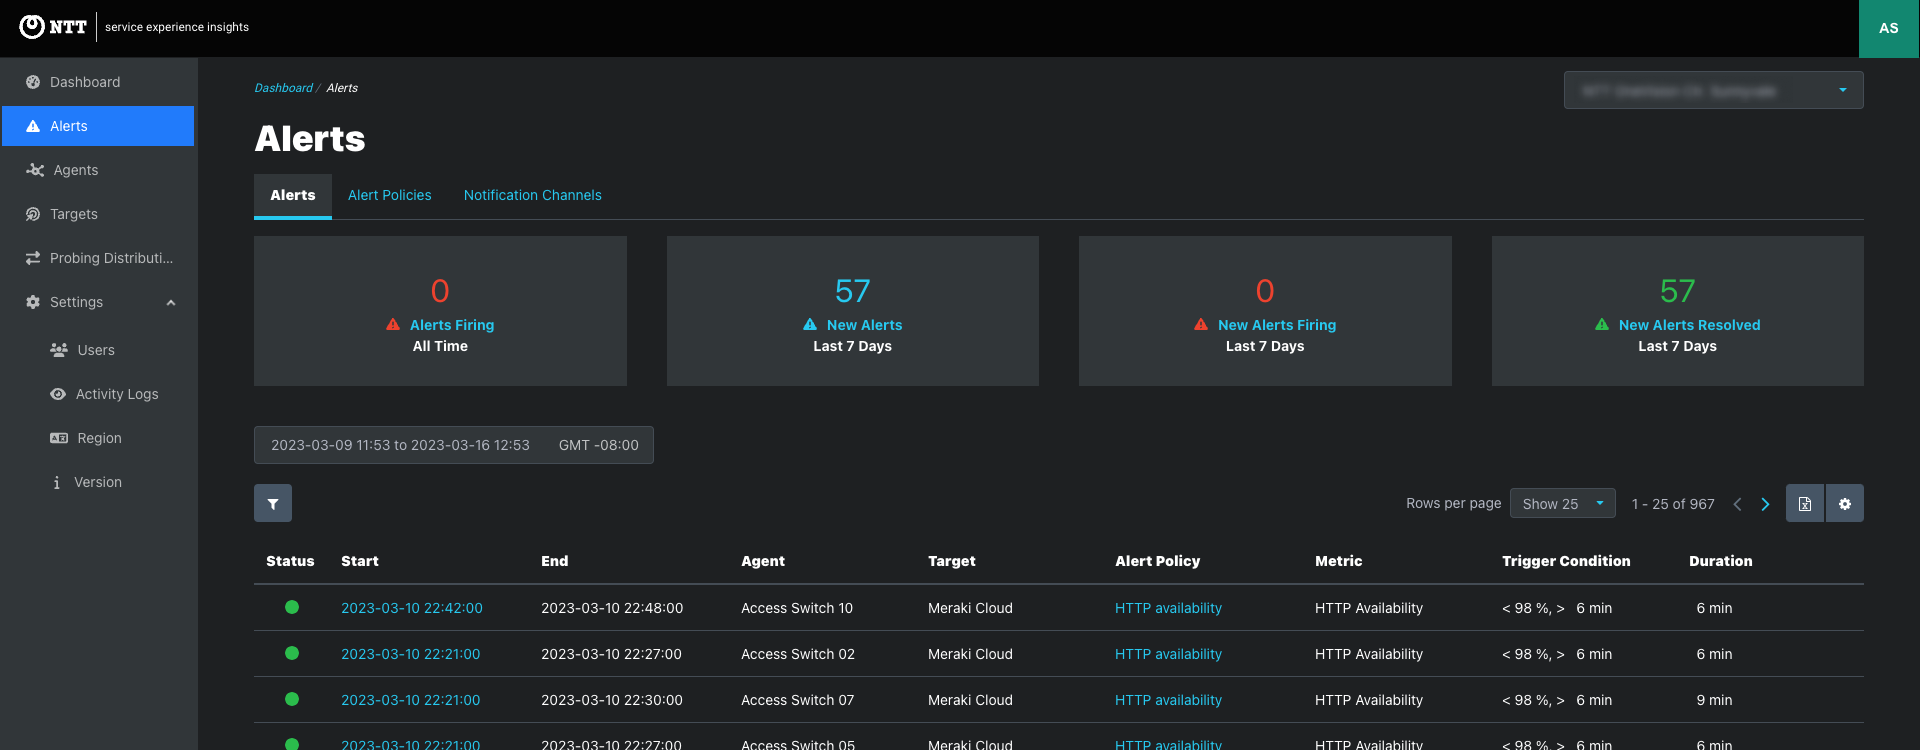
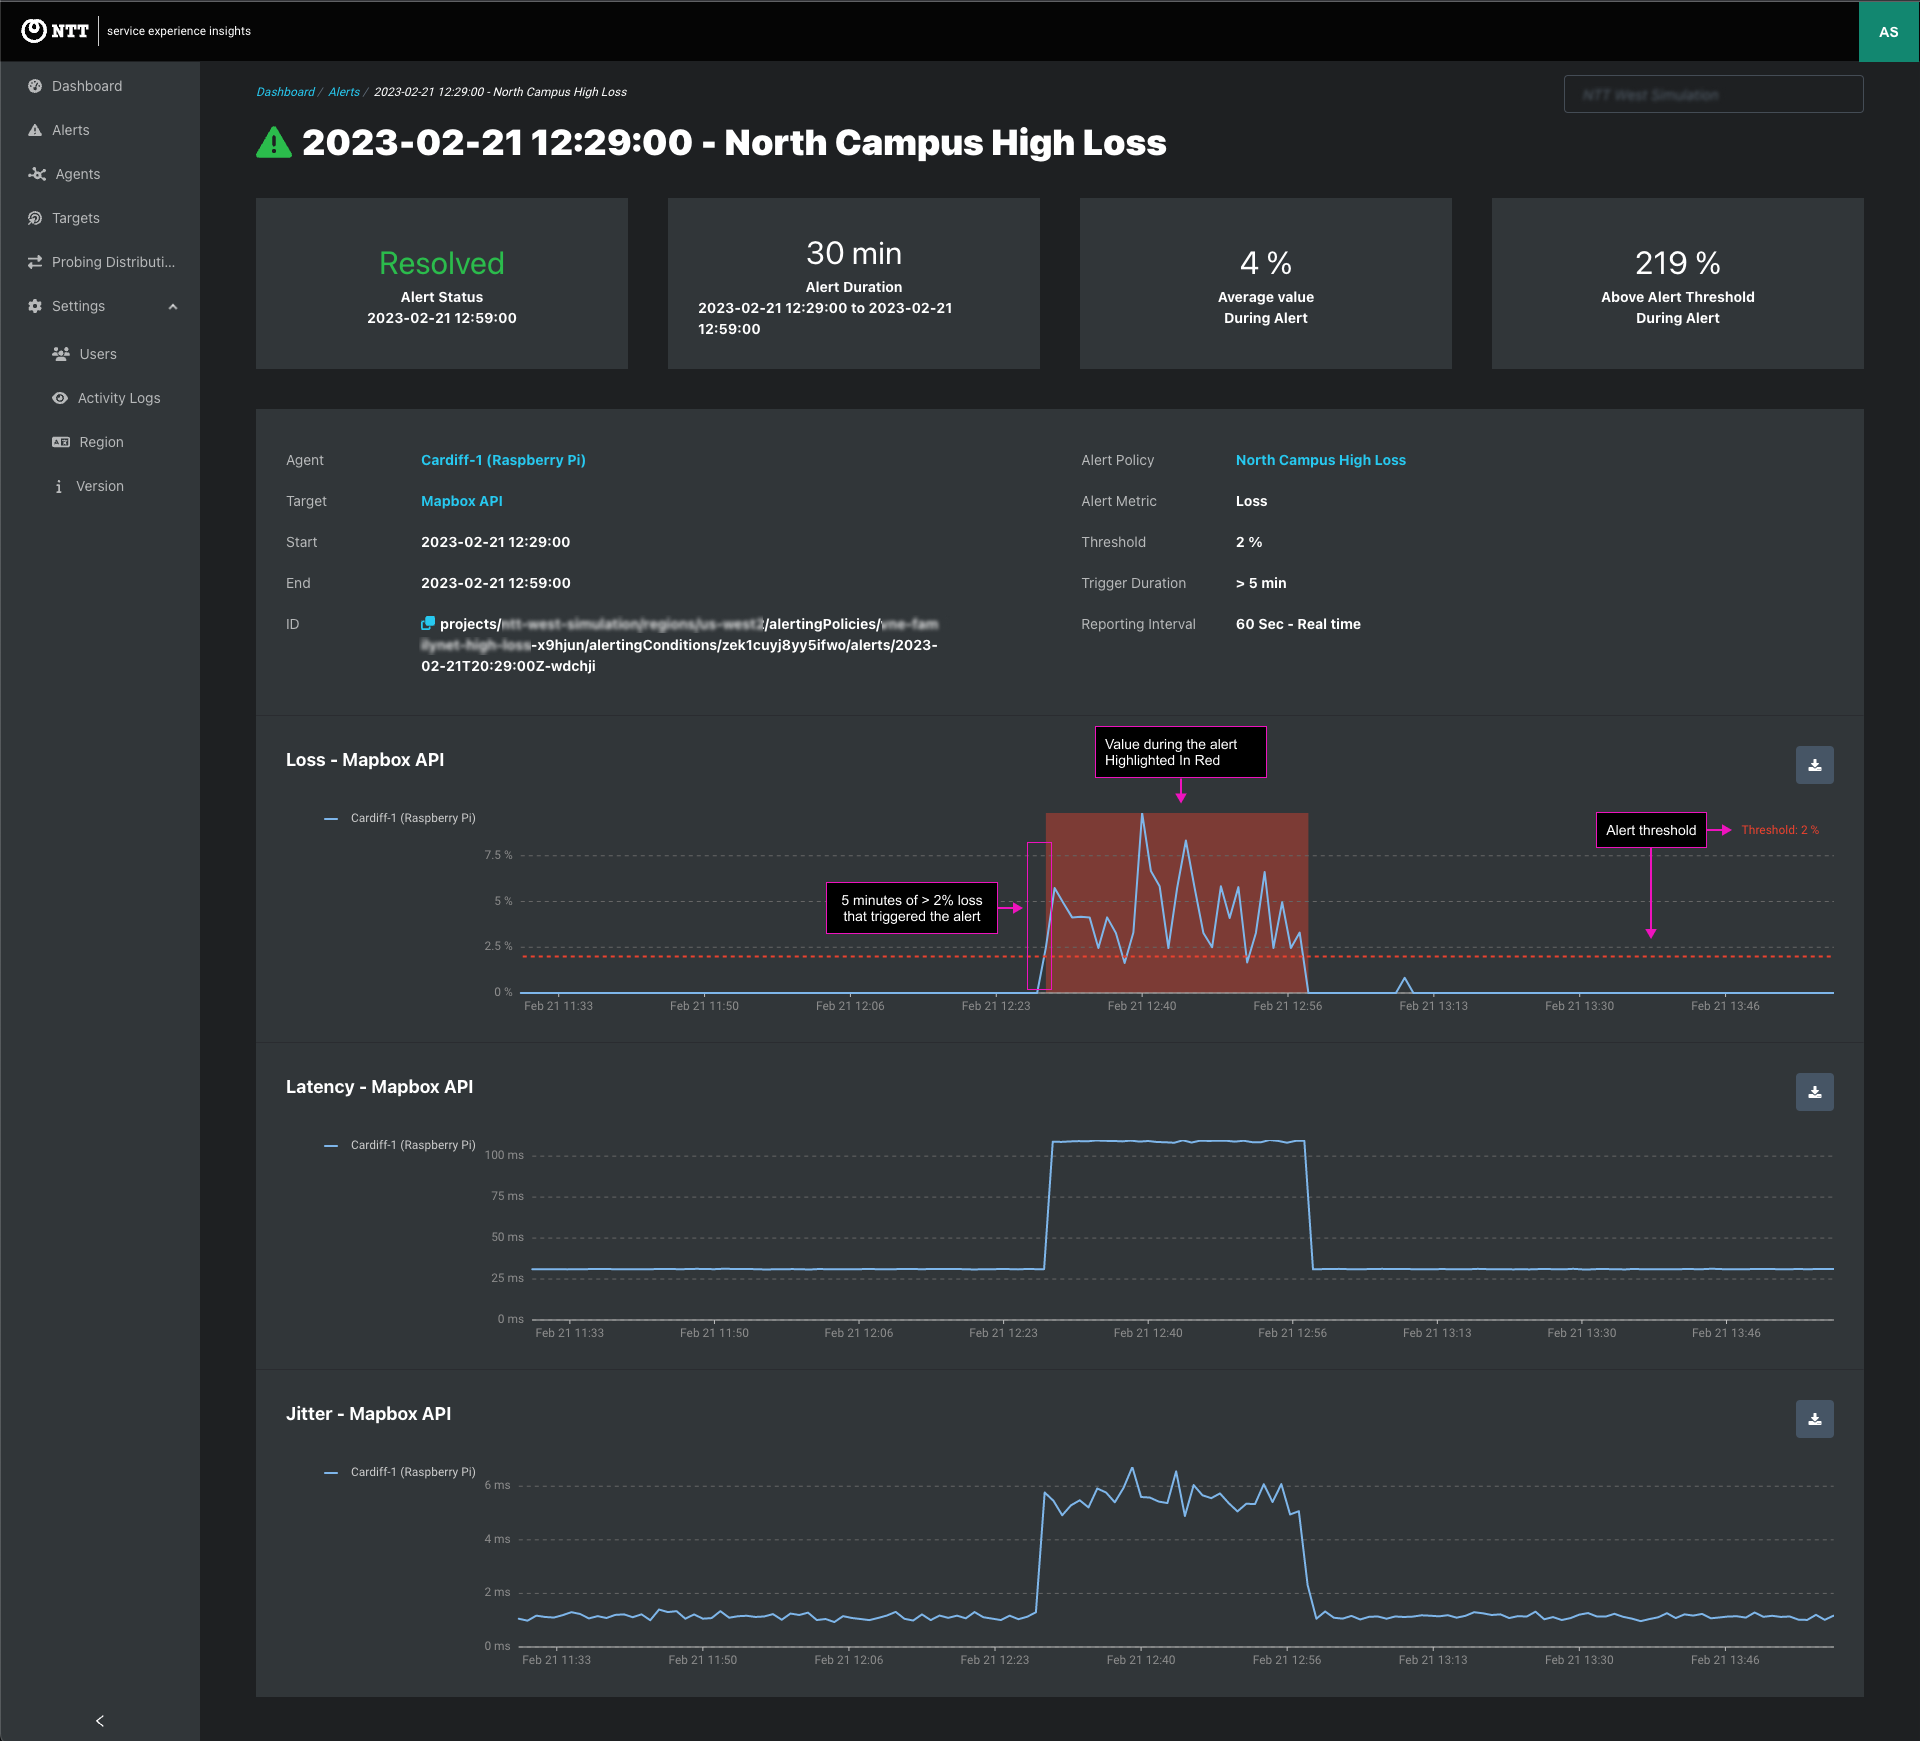
Service Experience Insights are a way for clients to continuously monitor how their users experience accessing key business-critical applications – whether they are in the Cloud or on-premise – from multiple locations on their network.

Service Experience Insights supports the following key use cases;

  1. Continuous path monitoring, including ping loss, latency, jitter, and ping round trip time between edge locations and SaaS, Cloud or on-premise targets.
  2. Speed test monitoring between edge locations and Cloud or on-premise targets.
  3. Internet path discovery and monitoring showing the route traffic takes from the edge location to targets.

Service Experience Insights are then combined with network metric information to provide a holistic view of network health and user experience to clients.


System Overview

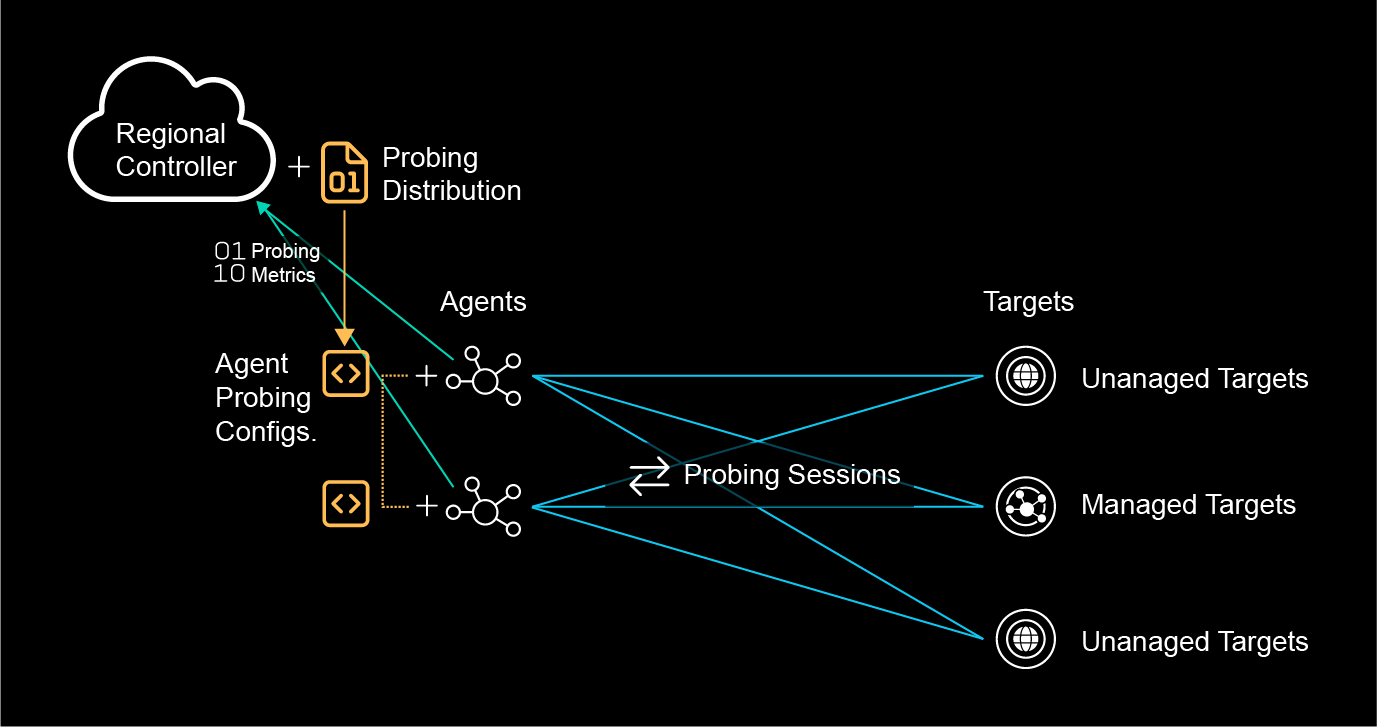
Service Experience Insights provides an easy-to-deploy flexible system for continuous monitoring between agents and targets.

  • Deploy lightweight probing agents.
  • Create sophisticated probing policies that logically map to the network.
  • Visualize real-time and time-series monitoring data in a stand-alone dashboard or in the NTT Service Portal.
  • Run instant network tests to troubleshoot issues in real-time.
Click to expand

Comprehensive, high-fidelity, and affordable network service experience monitoring tooling.

Flexibility to monitor rapidly evolving network topologies and changing client business requirements, with the necessary granularity of client's demand.

Vendor and topology agnostic solution designed to address as many client use cases as possible.

Simple to deploy, simple to use SaaS-based platform designed to provide an observability layer on top of networks under management by NTT.

Agents

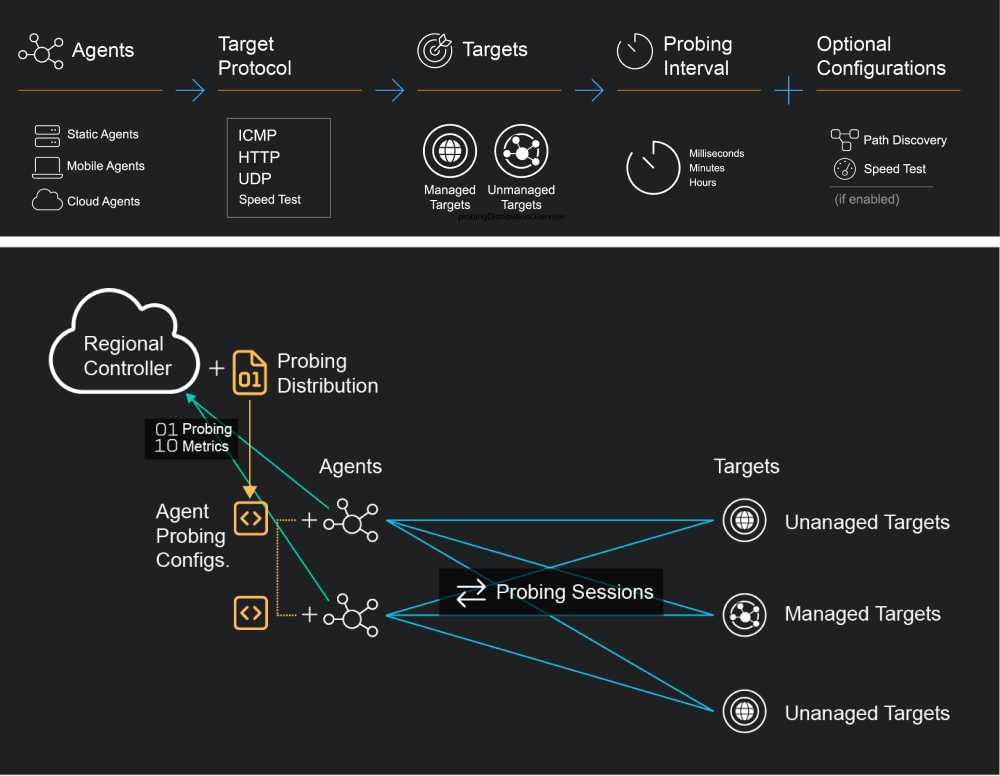
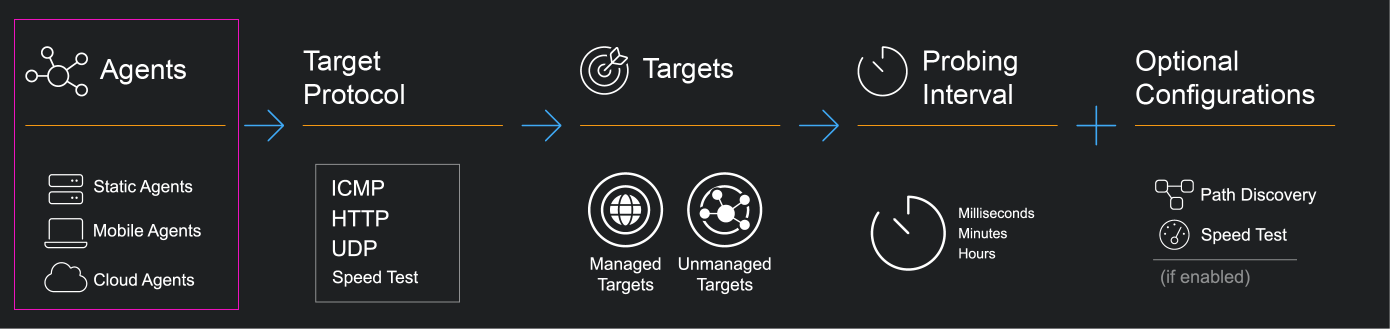
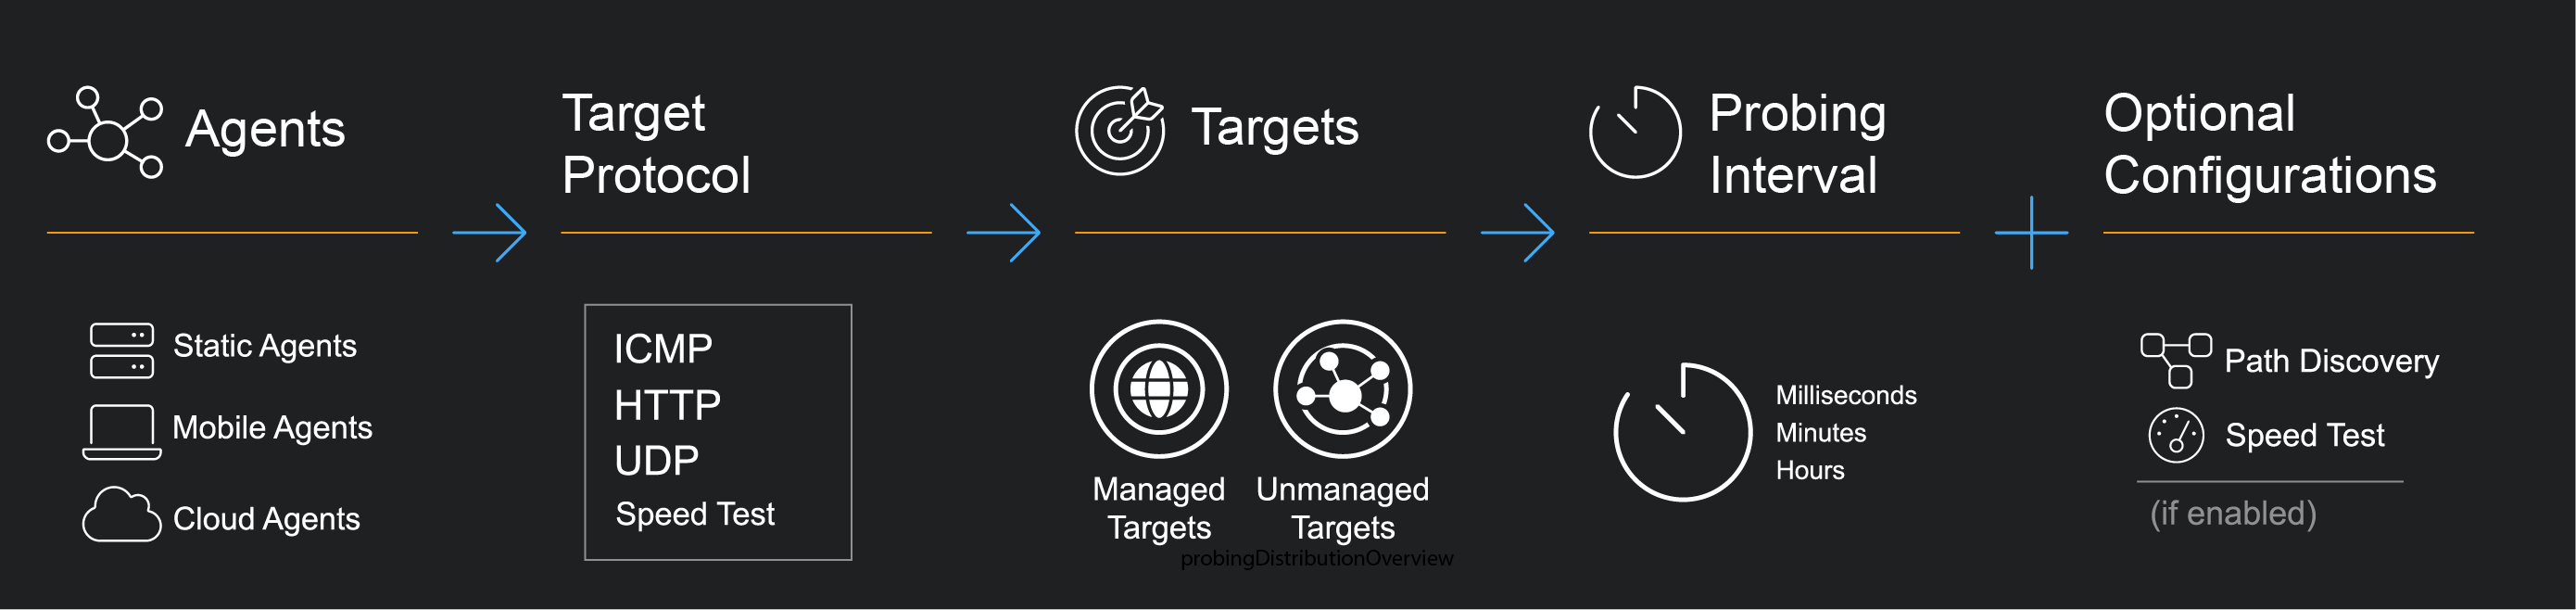
Agents are lightweight probing software that can be configured to send synthetic probing traffic to internet endpoints and other agents in order to monitor the quality of network traffic to business-critical services continuously.

Click to expand

The agent is configured to periodically send synthetic probing traffic to internet endpoints and other agents within the network. This synthetic traffic mimics the behavior of actual network traffic and is used to test the quality and performance of the network. By sending synthetic traffic, the agent can detect any issues with the network before they become critical problems.

A variety of agent software is provided to support deployment in heterogeneous network environments.

Static Agents

For dedicated network devices

SPEKTRA Edge appliances and deployed to generic devices running EdgeLQ OS.

Static Agents

For application-hosting network appliances

Deploy in Docker containers to Cisco 9K series application-hosting routers and switches.

Cloud Agents

For data centers and cloud environments

Deploy to VMs with Docker runtime hosted in public or private cloud environments.

Mobile Agents

For mobile end-user devices

Deploy as native applications on Windows and macOS – Self Installation and Endpoint Management Supported.

The agent can be configured to send different ICMP, HTTP, UDP, and Speed Test synthetic traffic. This allows the agent to simulate different types of network traffic and to test various aspects of the network, such as latency, packet loss, bandwidth, and throughput.

The agent can be configured to send synthetic traffic to specific endpoints or hosts within the network, such as business-critical services or servers. This allows the agent to monitor the performance of these services and to detect any issues that may impact the availability or quality of the service. The agent can also be configured to send synthetic traffic to external endpoints, such as public websites or cloud services. This allows the agent to monitor the performance of external services that may impact the network’s performance, such as cloud applications or third-party services.


Targets

Click to expand

Target Types

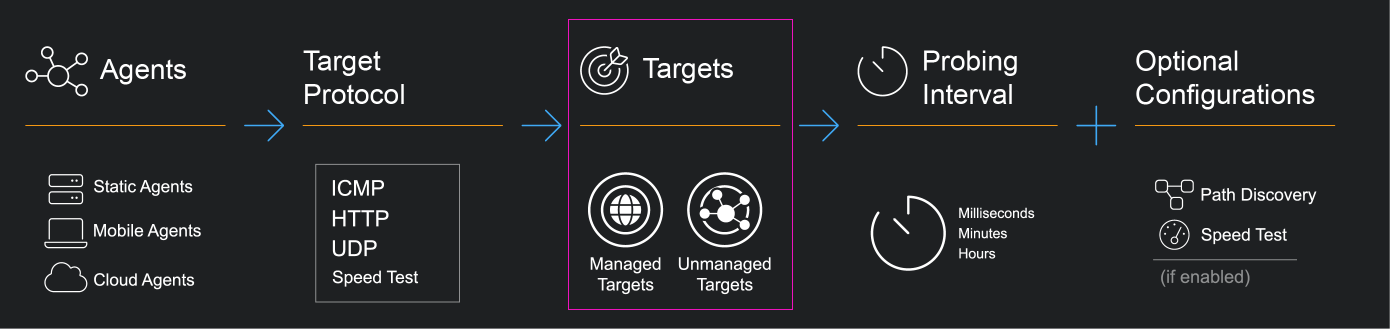
Service Experience Insight supports Unmanaged Targets and Managed Targets.

  • Unmanaged Targets are public IP addresses and domains that receive synthetic probing traffic from agents.
  • Managed Targets are agents with target functionality enabled that receive synthetic probing traffic from other agents.
  • Probing protocol and available metrics vary by the type of target.


Protocols

ICMP HTTP UDP Speed Test
Unmanaged Targets --
Managed Targets --


Metrics by protocol

ICMP HTTP UDP Speed Test
Latency (ms) --
Jitter (ms) --
Loss (%) -- --
HTTP Availability (%) -- -- --
HTTP Request Response Time (ms) -- -- --
Connection set up DNS lookup (ms) -- -- --
Initial connection (ms) -- -- --
SSL (ms) -- -- --
Request Response Request Send (ms) -- -- --
Waiting TTFB (ms) -- -- --
Content Download (ms) -- -- --
Hops Latency (ms) --
Probing Interval Default 30 seconds 60 seconds 30 seconds 1 hour
Probing Interval Custom 1 sec. to 10 min. 30 sec. to 10 min. 100 millisec. to 10 min. 1, 6, 12, 24 hrs.
Probing Duration NA NA NA 3, 8, or 10 sec.


Probing Distributions

Probing Distributions are configurable policies for triggering synthetic monitoring traffic between agents and targets.

  • Multiple probing distributions are created in the dashboard for each tenant and stored on the regional controller.
  • Probing distributions define:

Click to expand
Probing Configuration
  • Once saved and enabled, the probing distribution issues a probing configuration to the selected agents.
  • The probing configuration instructs the agent to probe the targets defined in the probing distribution, the desired probing method, and how often to probe each target.
  • Changes to the probing distribution include adding or removing targets, enabling path discovery, or changing the probing interval
  • The controller pushes updates to each agent every 60 seconds.
  • New metrics are visible on the dashboard within five minutes.

Probing Sessions and Probing Events
  • Probing session is the configuration for one agent to send probing packets to one target.
  • Probing event is each instance that probing packets are sent in the probing session.

Click to expand


Alerts

  • The Alerts feature helps The Service Experience Insights users improve service quality and user satisfaction through proactive performance monitoring, issue identification, and faster resolution.
  • The Service Experience Insights Alerts feature enables users to create threshold-based Alert Policies that continuously monitor the performance of agent-to-target paths. These policies trigger Alerts and Alert Notifications when the observed metrics violate the threshold for the duration of the event. Create Alert Policies to monitor latency, jitter, loss, HTTP target availability, WiFi signal strength, and agent connectivity. Configure the trigger conditions and notification channels for Alerts triggered by the Alert Policy.
  • Alerts are stored in time series and listed in the Alerts table. Each Alert links to an Alert page that shows the threshold and the observed metrics before, during, and after the event—view by searching the Alerts table or clicking through from a notification.
  • Receive alerts for a single agent-to-target path or use Agent and Targets Groups to trigger alerts that identify issues specific to certain regions or network segments.
  • Subscribe to alerts via webhooks or email. Webhooks allow users to receive real-time notifications and trigger automated actions responding to an alert, such as populating a Slack channel. Subscribe to a webhook to receive a JSON file for alerts grouped by Alert Policy. Use webhooks with your existing systems to automate tasks like sending an SMS message or opening a ticket in a service management tool.

Click to expand

Click to expand

User Management

User management enables Admins and Co-admins to manage user access to each project.

  • User roles define read/write privileges for dashboard features and resources.
  • Users are added by project.
  • Send emailinvitations to new users requiring login credentials and MFA setup.
  • Create role bindings for users with existing login credentials to another project or have been added through an enterprise SAML integration.
    • Role bindings enable admins to add users with existing credentials to additional projects without using a project invitation.
    • Role bindings can also be used to add users in an enterprise SAML integration to projects.


Activity Logs

  • Activity logs enable users to filter and view changes to resources, metrics, and users logged by the system.
  • Logs provide a record of changes like when invited users join the project, agents were added to a probing distribution, etc. Logs do not replicate metrics data found elsewhere in the dashboard.
  • Using logs requires setting a time range and filter logs by:
    • Category: Types of changes like creation, deletion, update, etc.
    • Service:
      • IAM is the system identity and authorization service for users, service accounts + keys, and groups. Filter this service for user invitation, account verification, update, and deletion activities.
      • Monitoring handles metrics data collection between agents and targets. Filter by this service to view data collection logs
      • Service manages resources like agents, targets, groups, and probing distributions. Filter by this service to view resource creation/deletion, update, and configuration logs.
    • User: This enables the sorting of logs associated with a change by the users.


In This Article