| Admin | Co-admin | Asset Manager | Viewer | ||
|---|---|---|---|---|---|
| Dashboard | View | ||||
| On-demand Speed Test | Run |
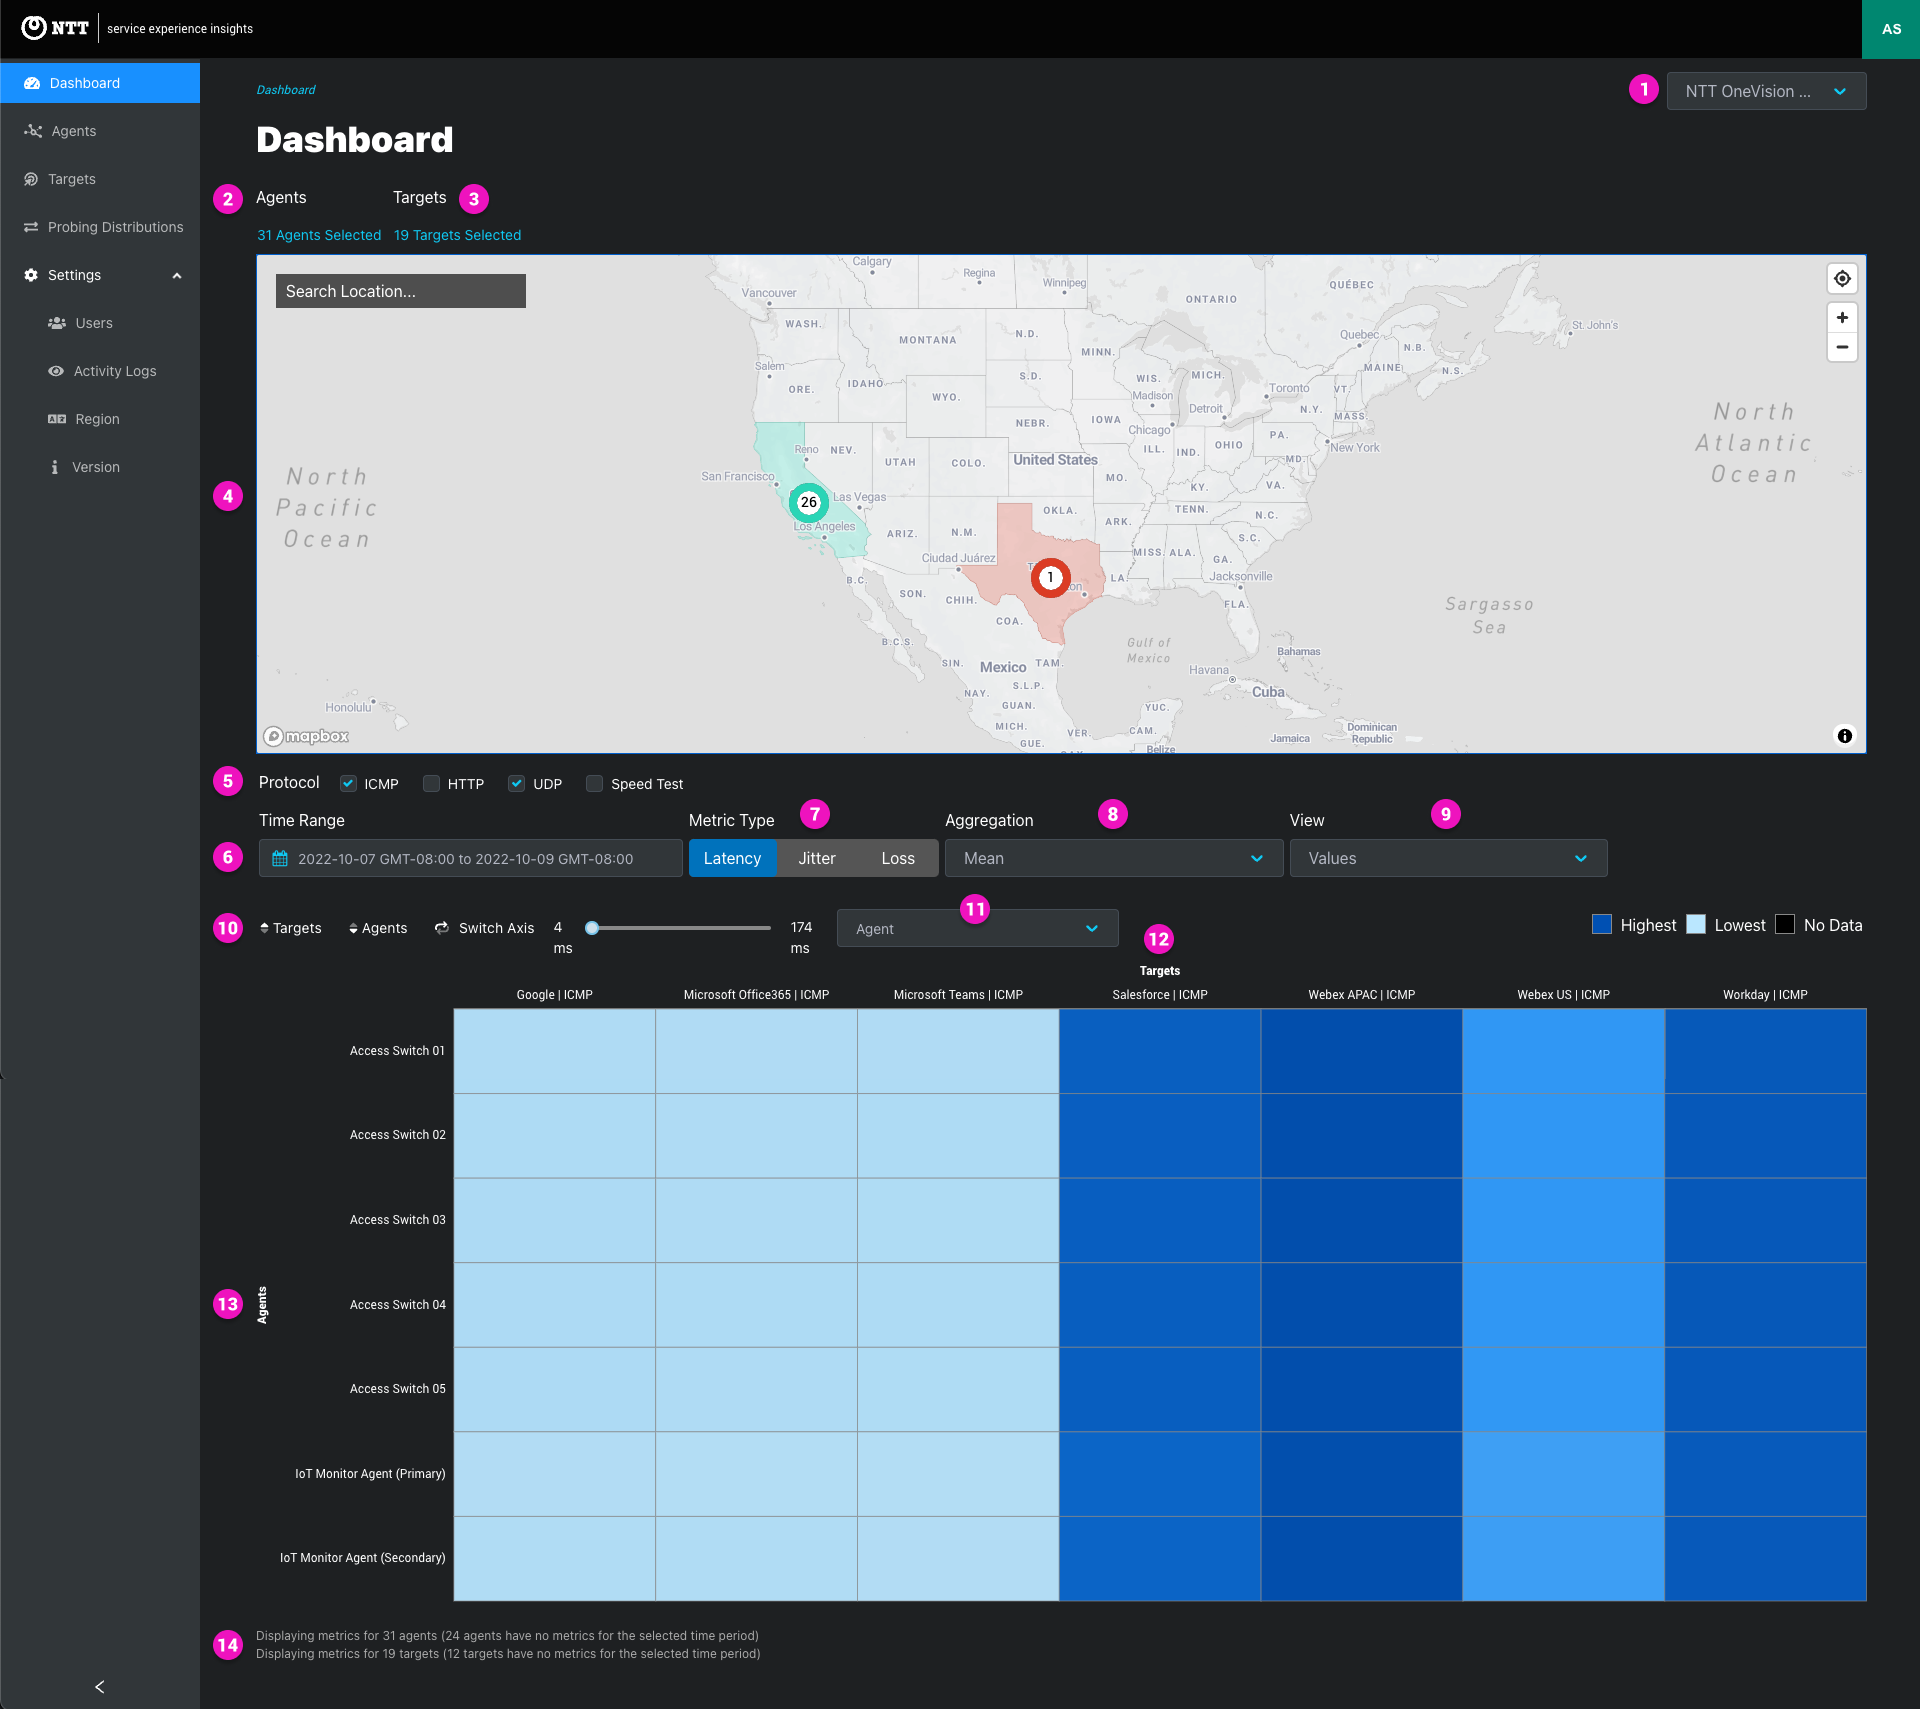
Project/tenant selector
Agent selector
Click the agent link to Search and filter agents to display
| Filter Key | Operator | Filter options | Usage tip |
|---|---|---|---|
| Activation status | equals | Inactive, Invitation Pending | All pending agents are inactive - Invitation Pending is the invitation status of pending agents using the emailed individual token activation method - Use this filter to view or exclude this unique agent type and state |
| Group | Contains | Groups list (multi-select) | - Filter by groups - Filter by No Group Assigned” to find ungrouped agents for editing |
| On/Off | equals | Online Agents, Offline Agents (single select) | Filter the by “Offline Agents” to quickly identify which agents are currently offline |
| OS | contains | Linux, macOS, Windows (multi-select) | - Linux filter returns cloud agents and static agents hosted on dedicated hardware running the EdgeLQ OS. Static agents running on application-hosting devices are not filterable by OS - macOS and Windows filter return mobile agents |
| Tags | contains Any | Tags list (multi-select) | Filter by tags assigned to agents |
| ISP | equals | ISP list (single select) | List shows the last ISP reported for the agents enrolled in the probing distribution |
| Contact | equals | Text (exact match) | Use text search if the exact spelling of the name is unknown |
Target selector
Click the target link to Search and filter targets to display
| Filter Key | Operator | Filter options | Usage tip |
|---|---|---|---|
| Group | contains | Groups list (single select) | - Filter by groups - Filter by “No Group Assigned” to find ungrouped agents for editing |
| Tags | contains Any | Tags list (multi-select) |
| Map Area Zoom Levels | Example |
|---|---|
| Country | Japan, UK, India |
| Admin Area 1: State, Prefecture, Nation (UK) | California, Kumamoto, Wales |
| Admin Area 2: County, Municipality | Berkshire, Santa Clara, Offenbach |
| Admin Area 3: City | New York, Tokyo, Hyderabad |
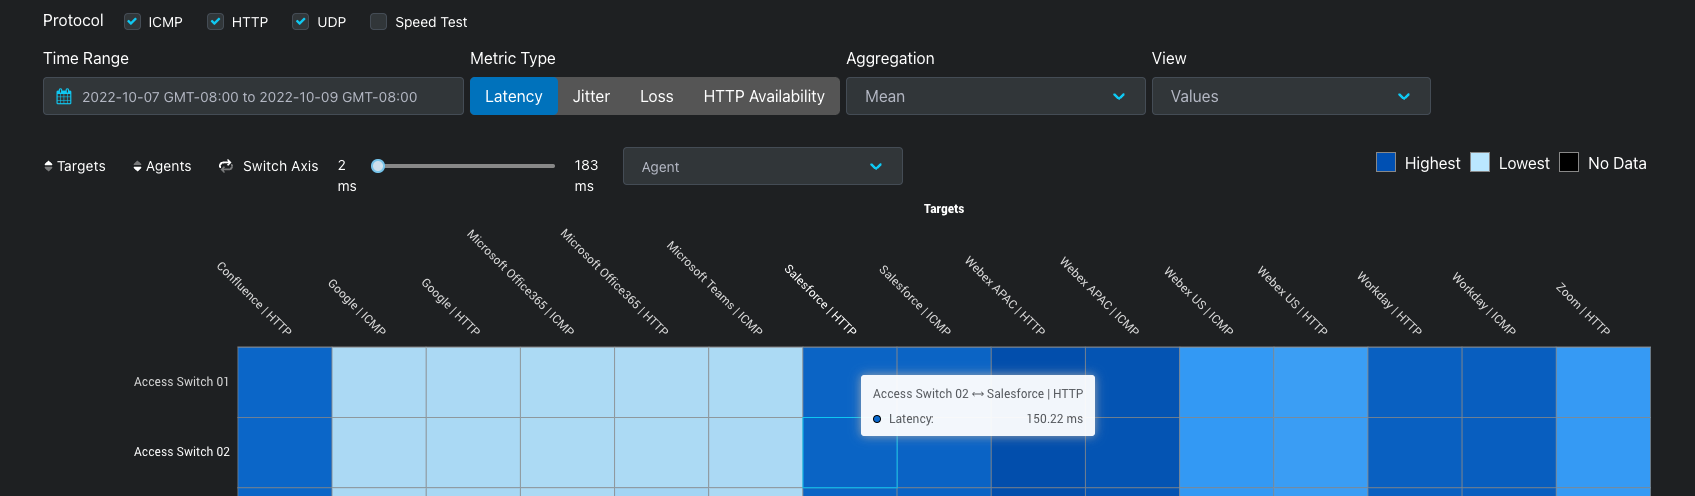
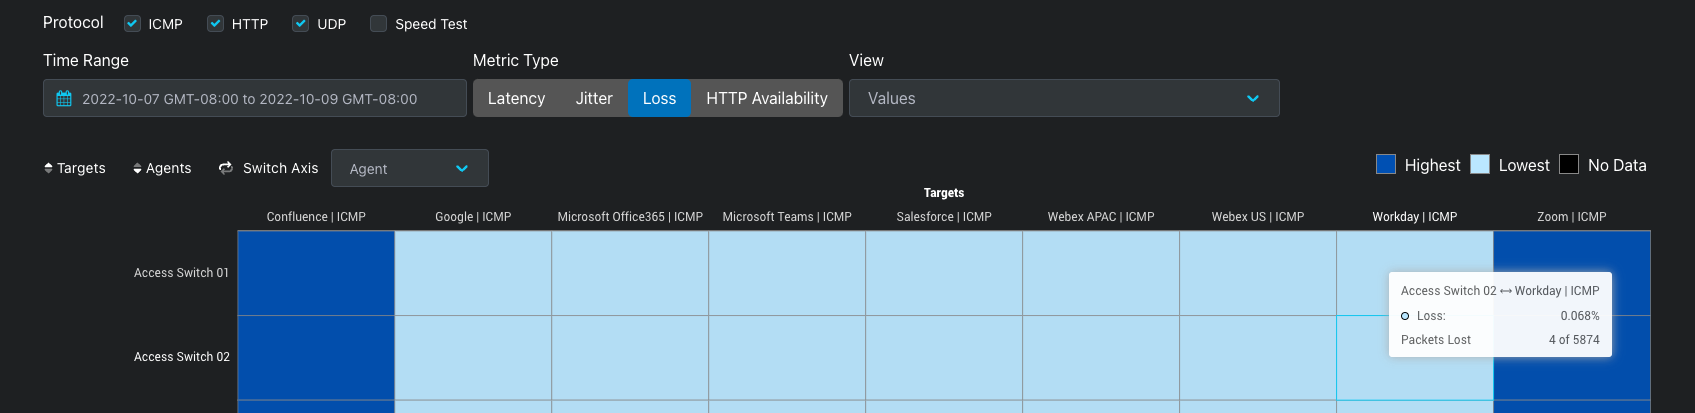
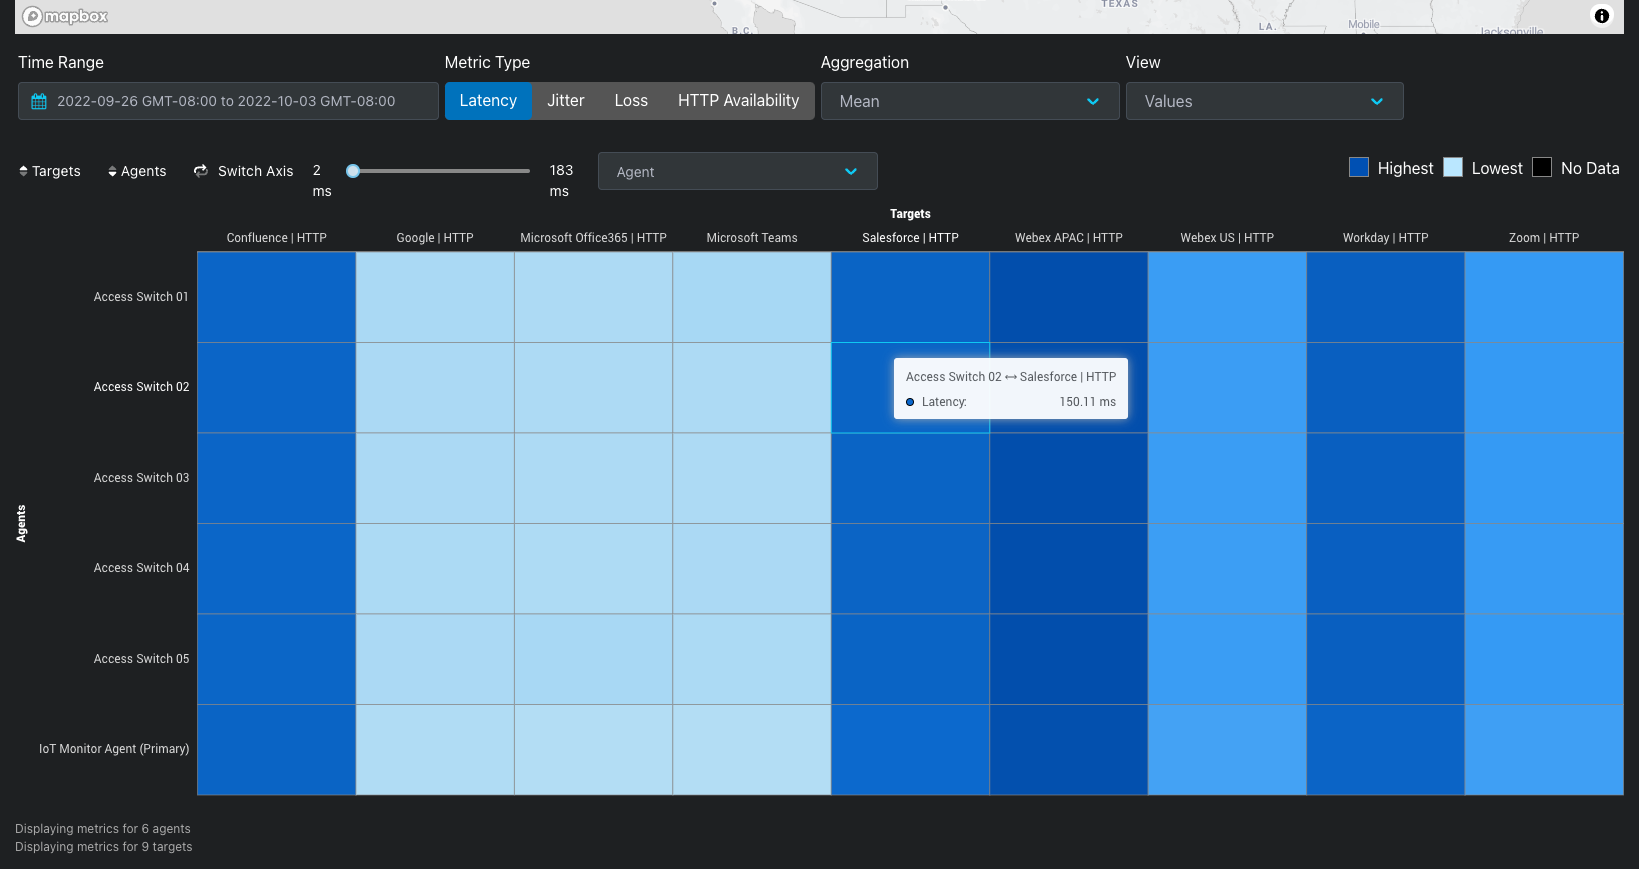
Protocol
Time range
Metric type
</div>
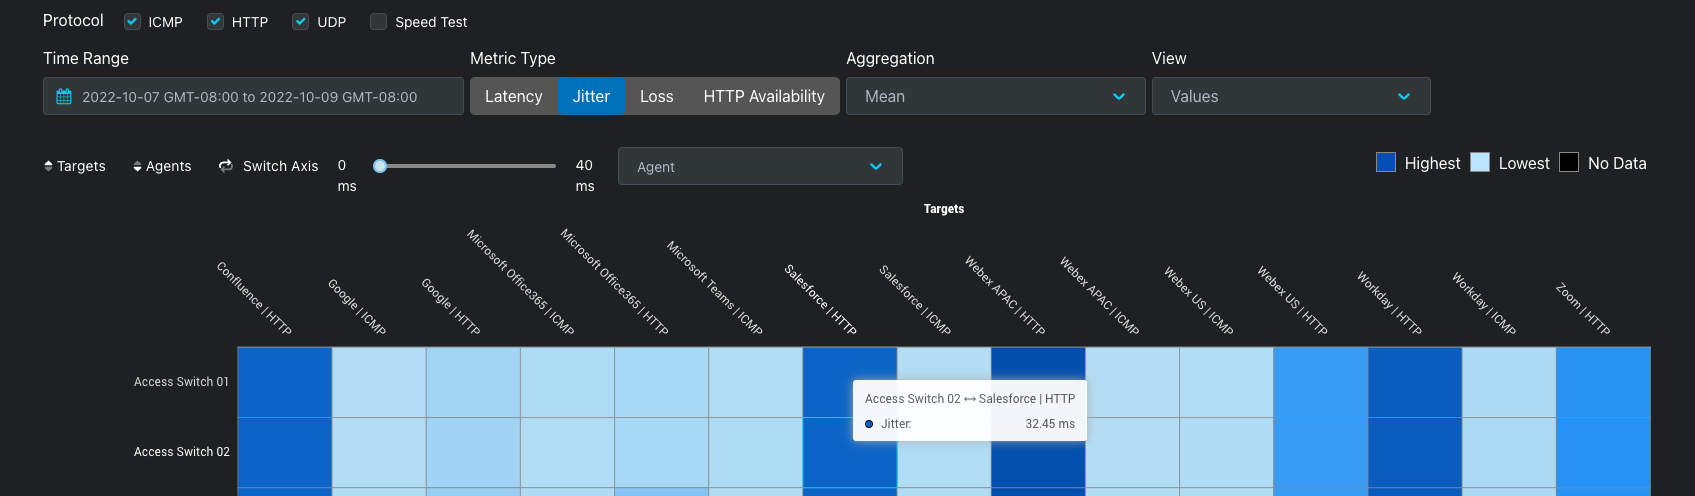
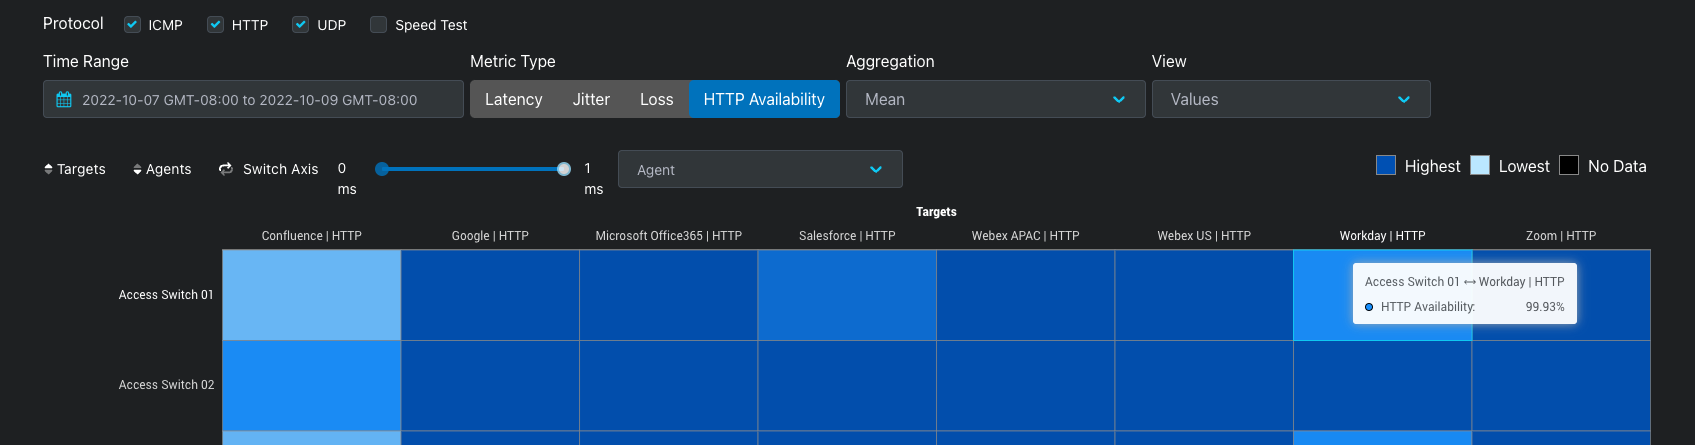
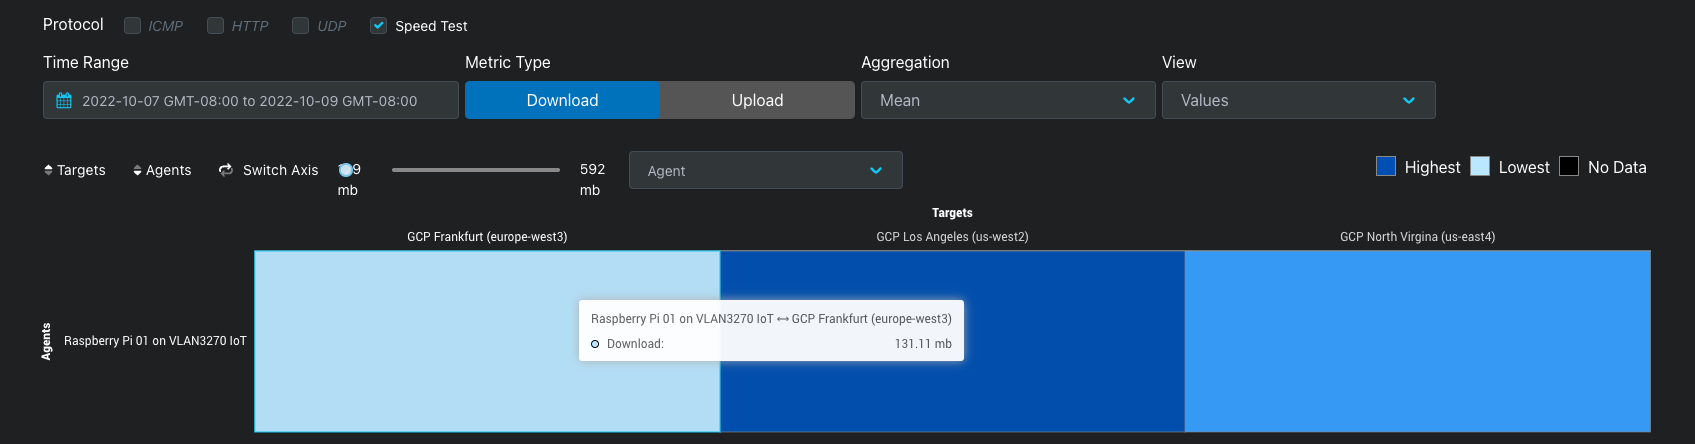
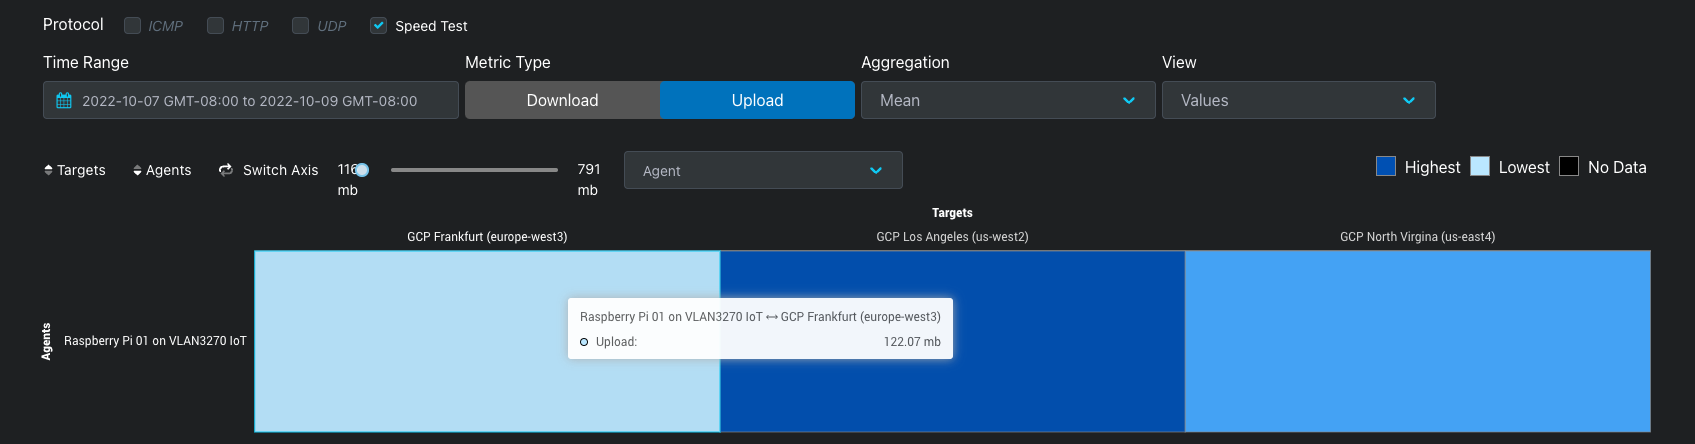
Aggregation
Heatmap Views
![]
^
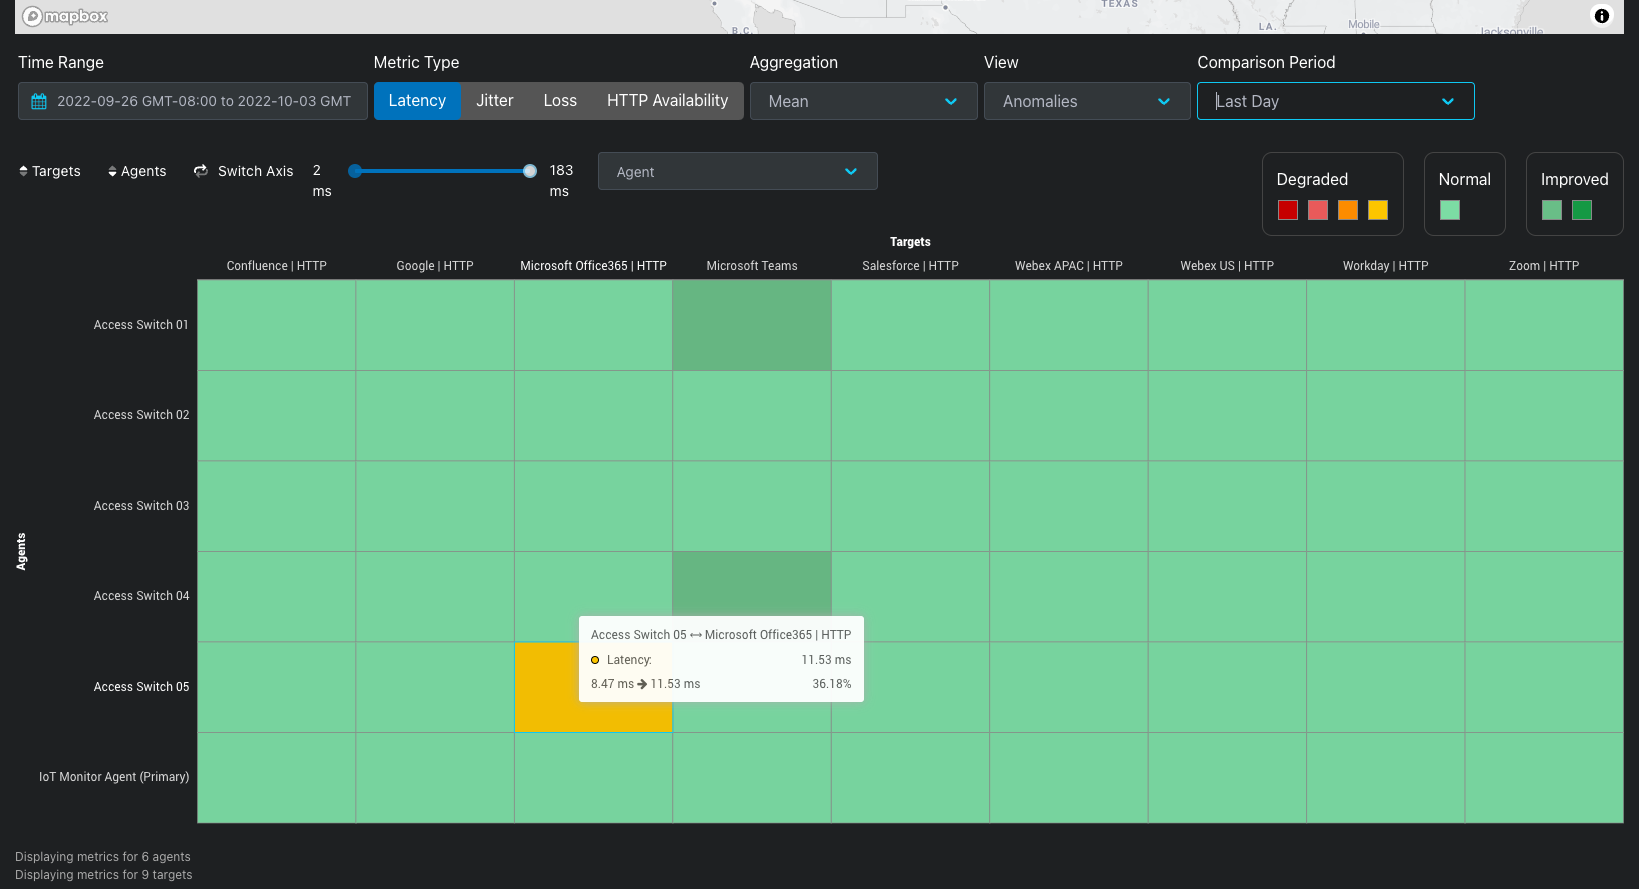
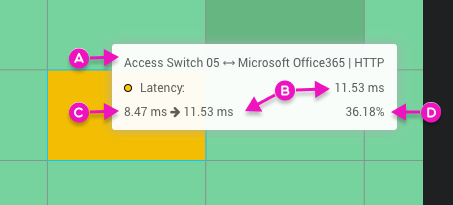
| Target: Microsoft Office365 | HTTP |
Heatmap sorting options
Heatmap regions and agents selector
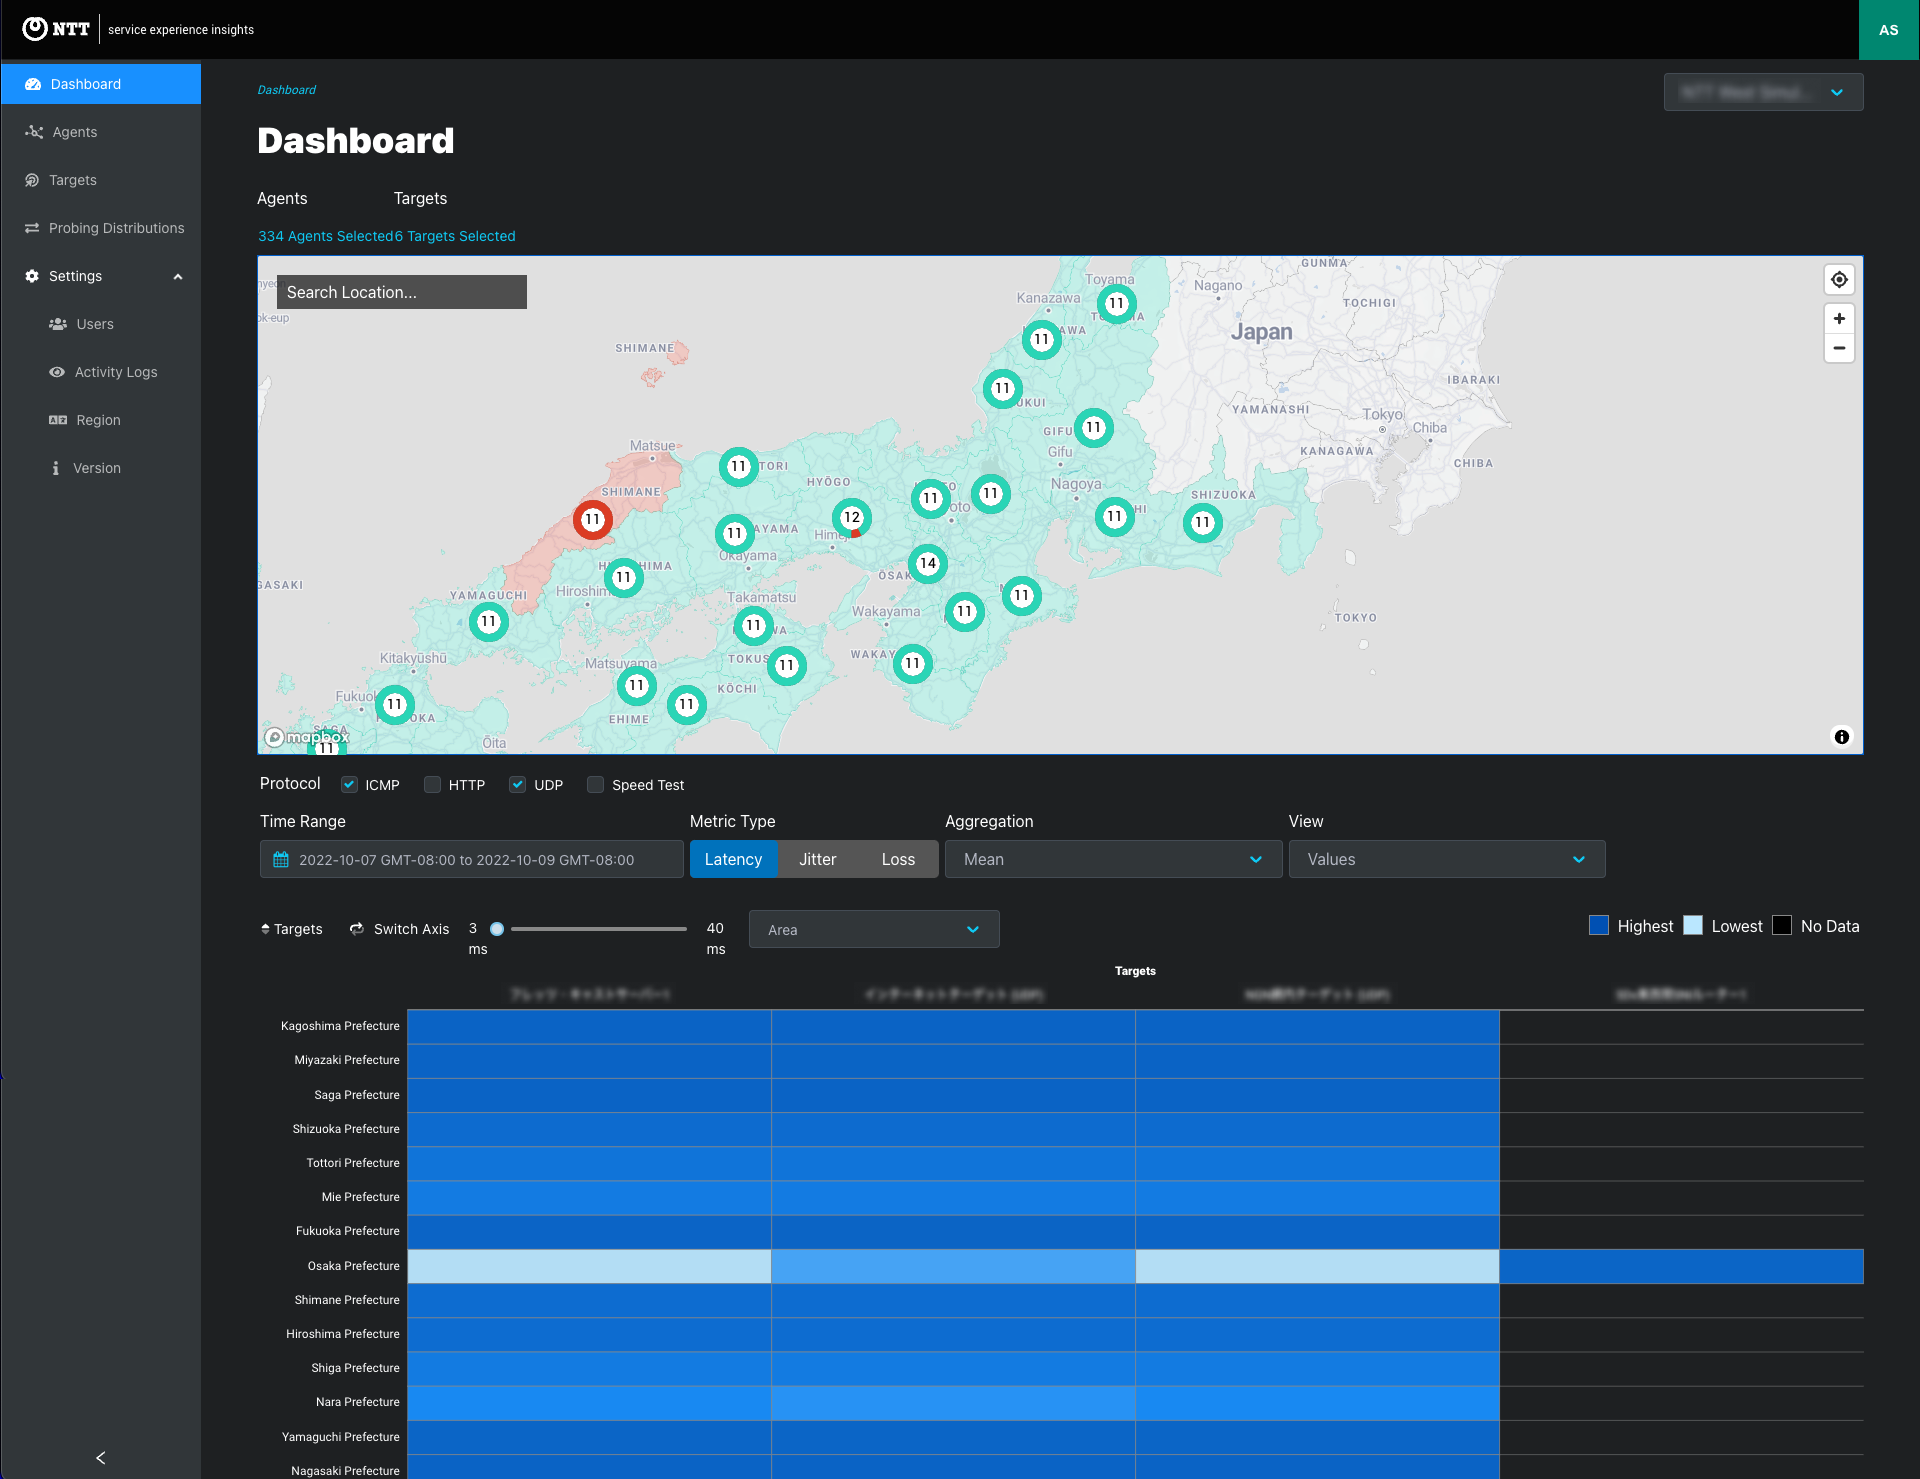
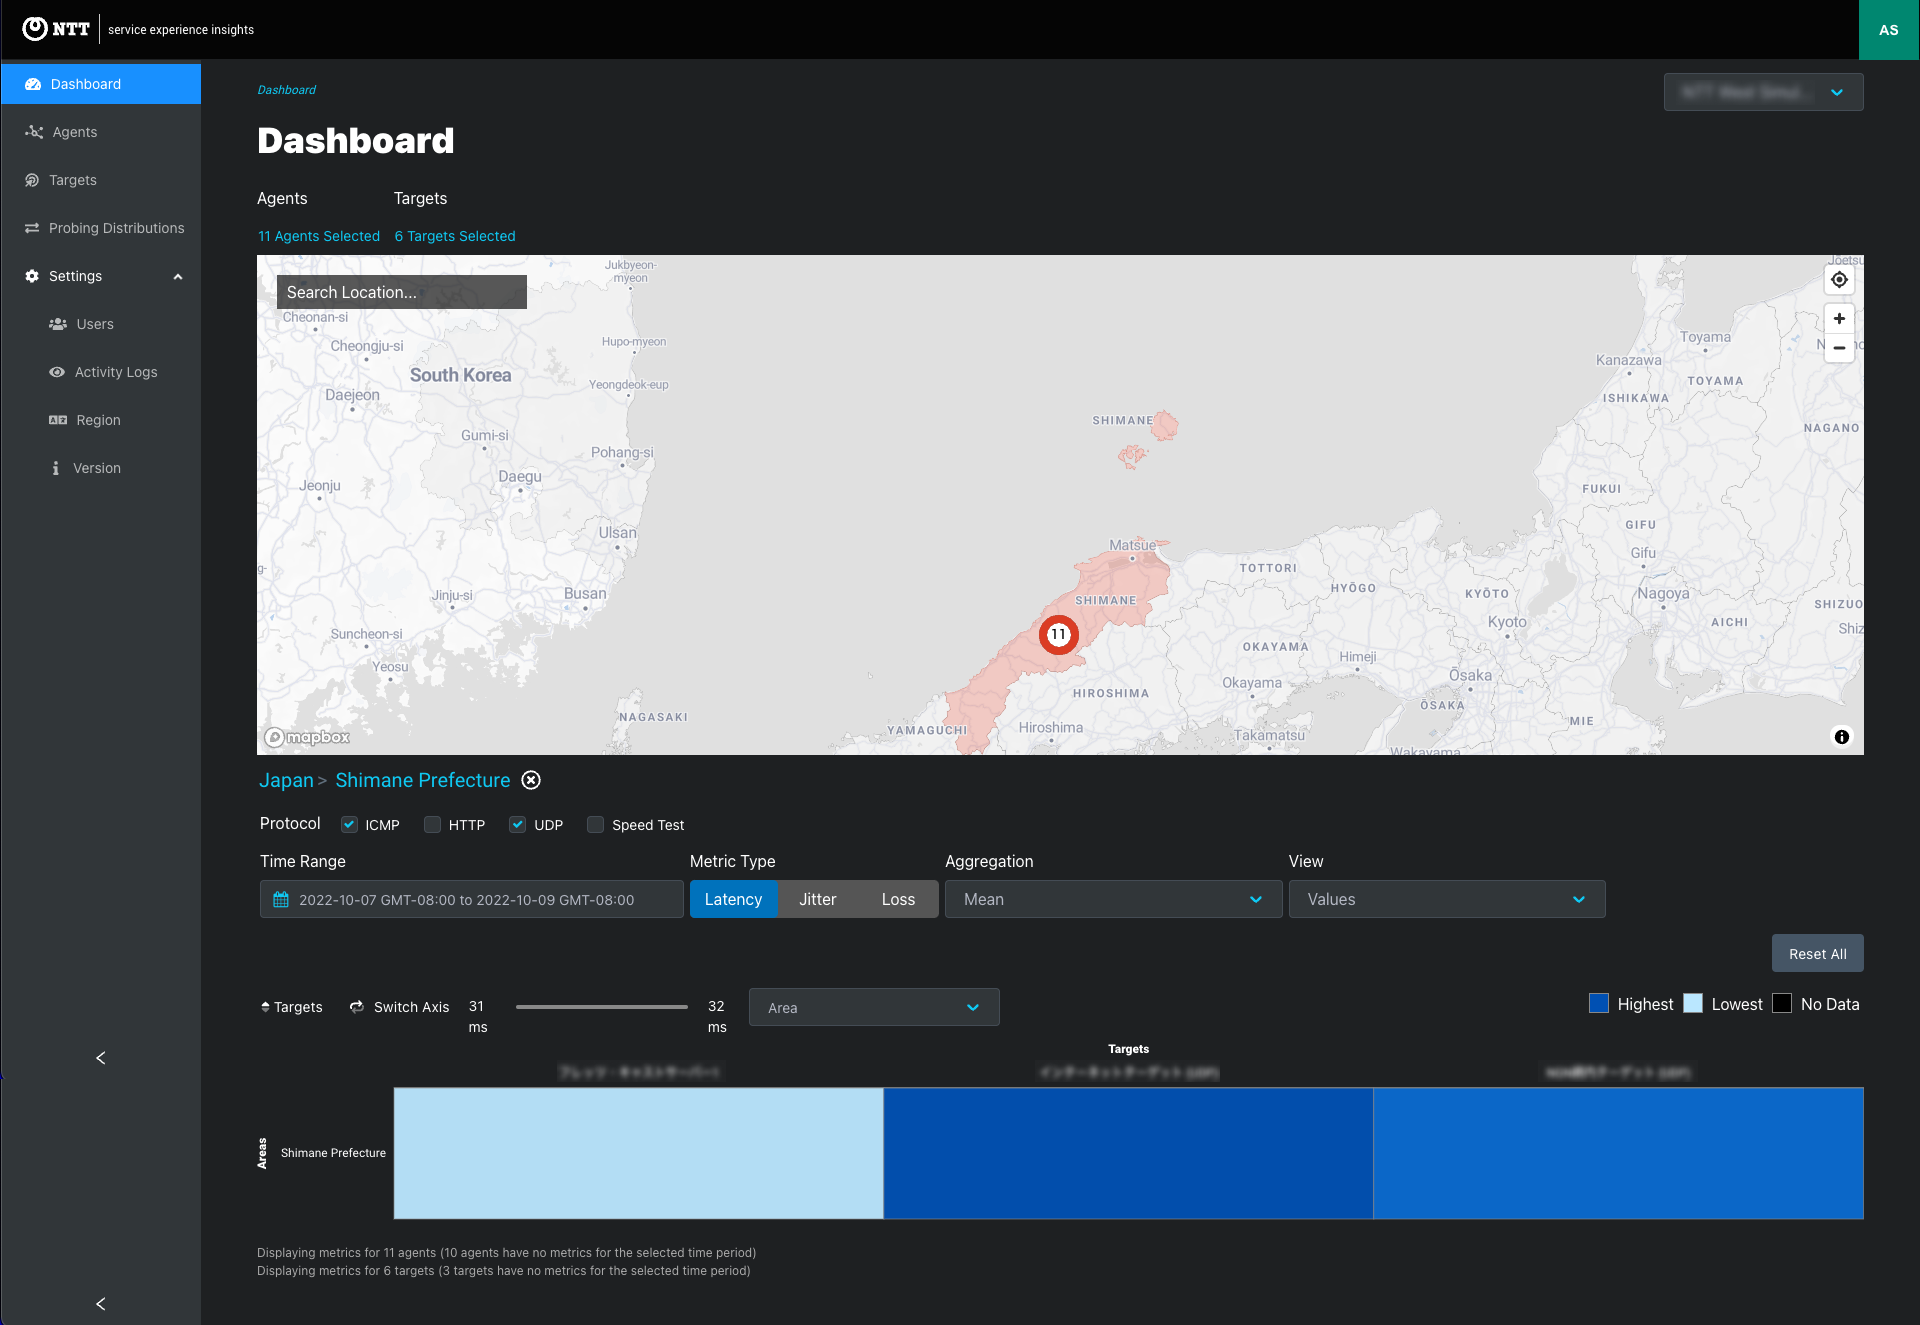
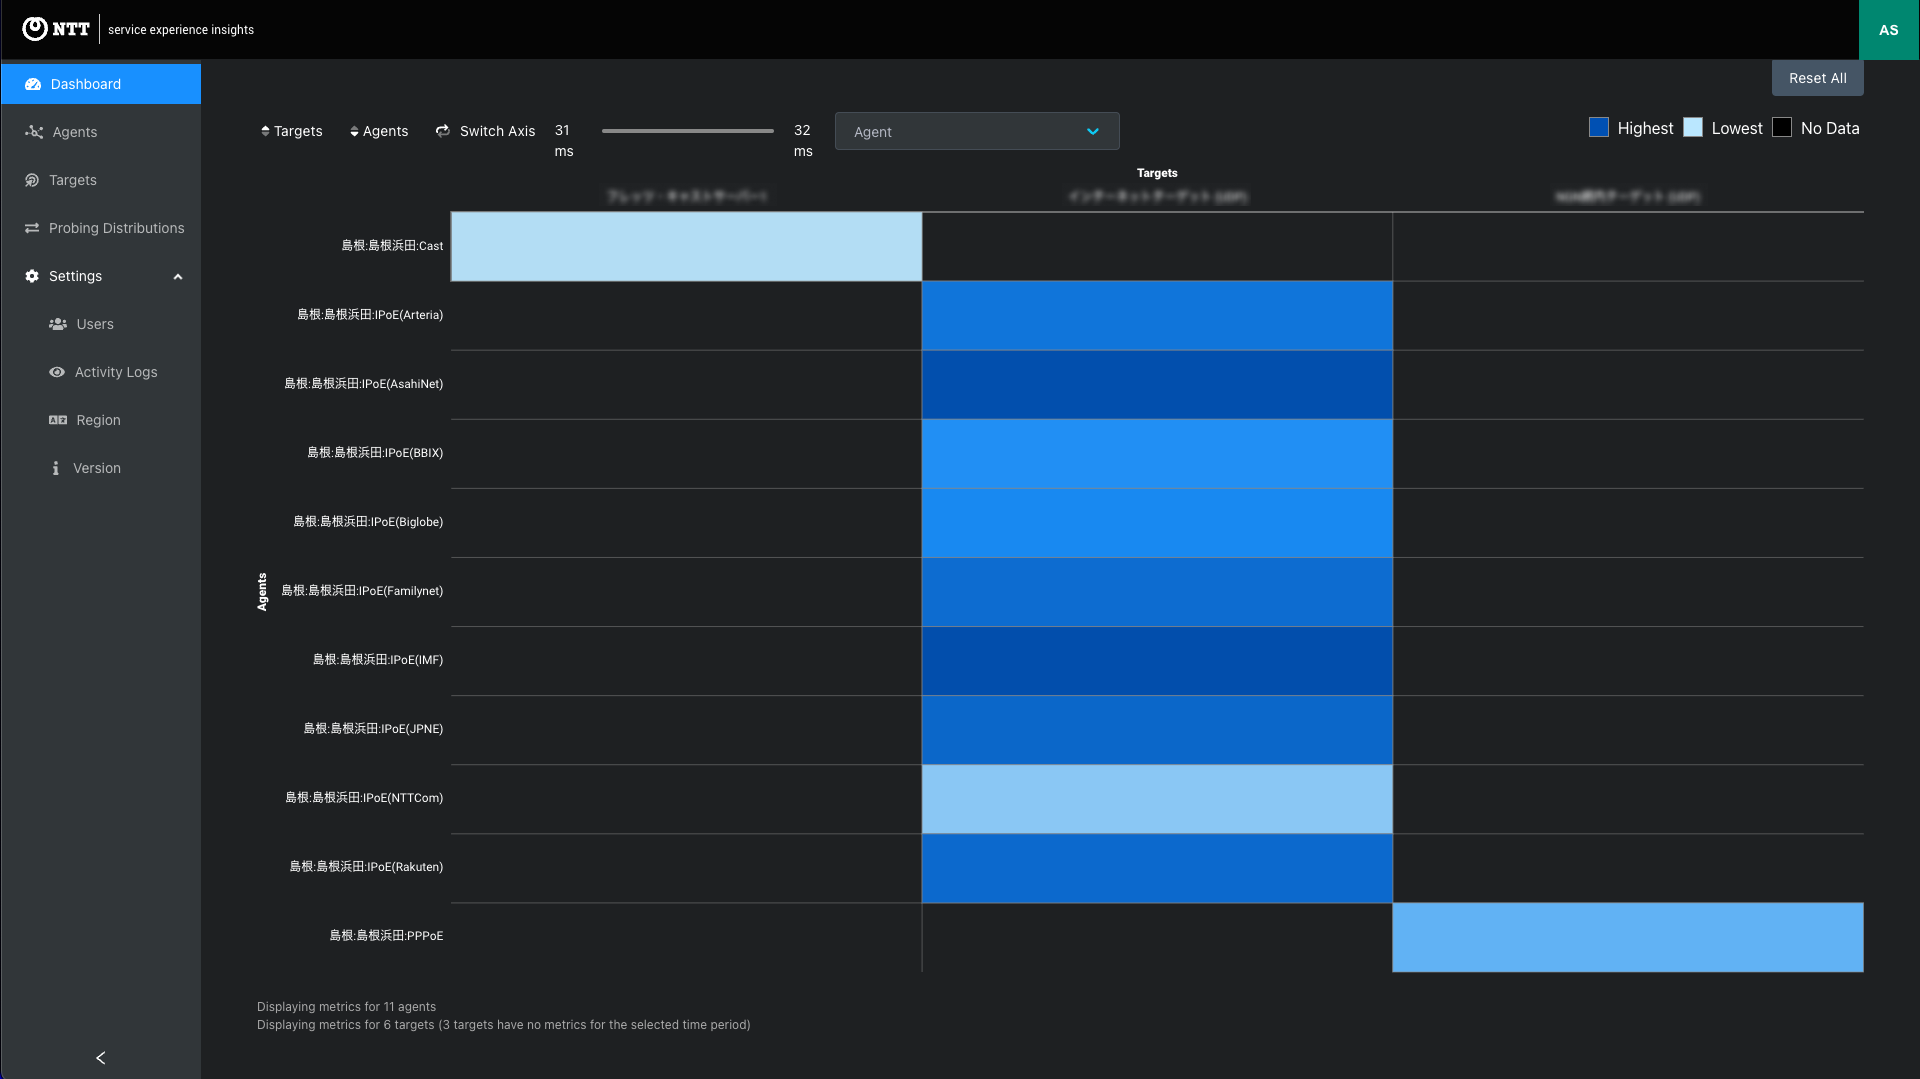
Targets
Agents
Heatmap summary message
The heatmap summary message reports the number of agents and targets with data metrics