Agent-to-target probing measures end-to-end network connectivity. Agents send packets to targets and measure the response. Hops along the way forward the packets to the final destination. This enables the viewer to quickly spot any changes in trends and find the affected parts of the network.
Packets are sent once, and each hop forwards the packet to other hops on the path to that target. The cumulative time it takes for each hop to forward the packet to the next hop determines the latency between the agent and the target.
The following article describes the types of metrics provided by agents.
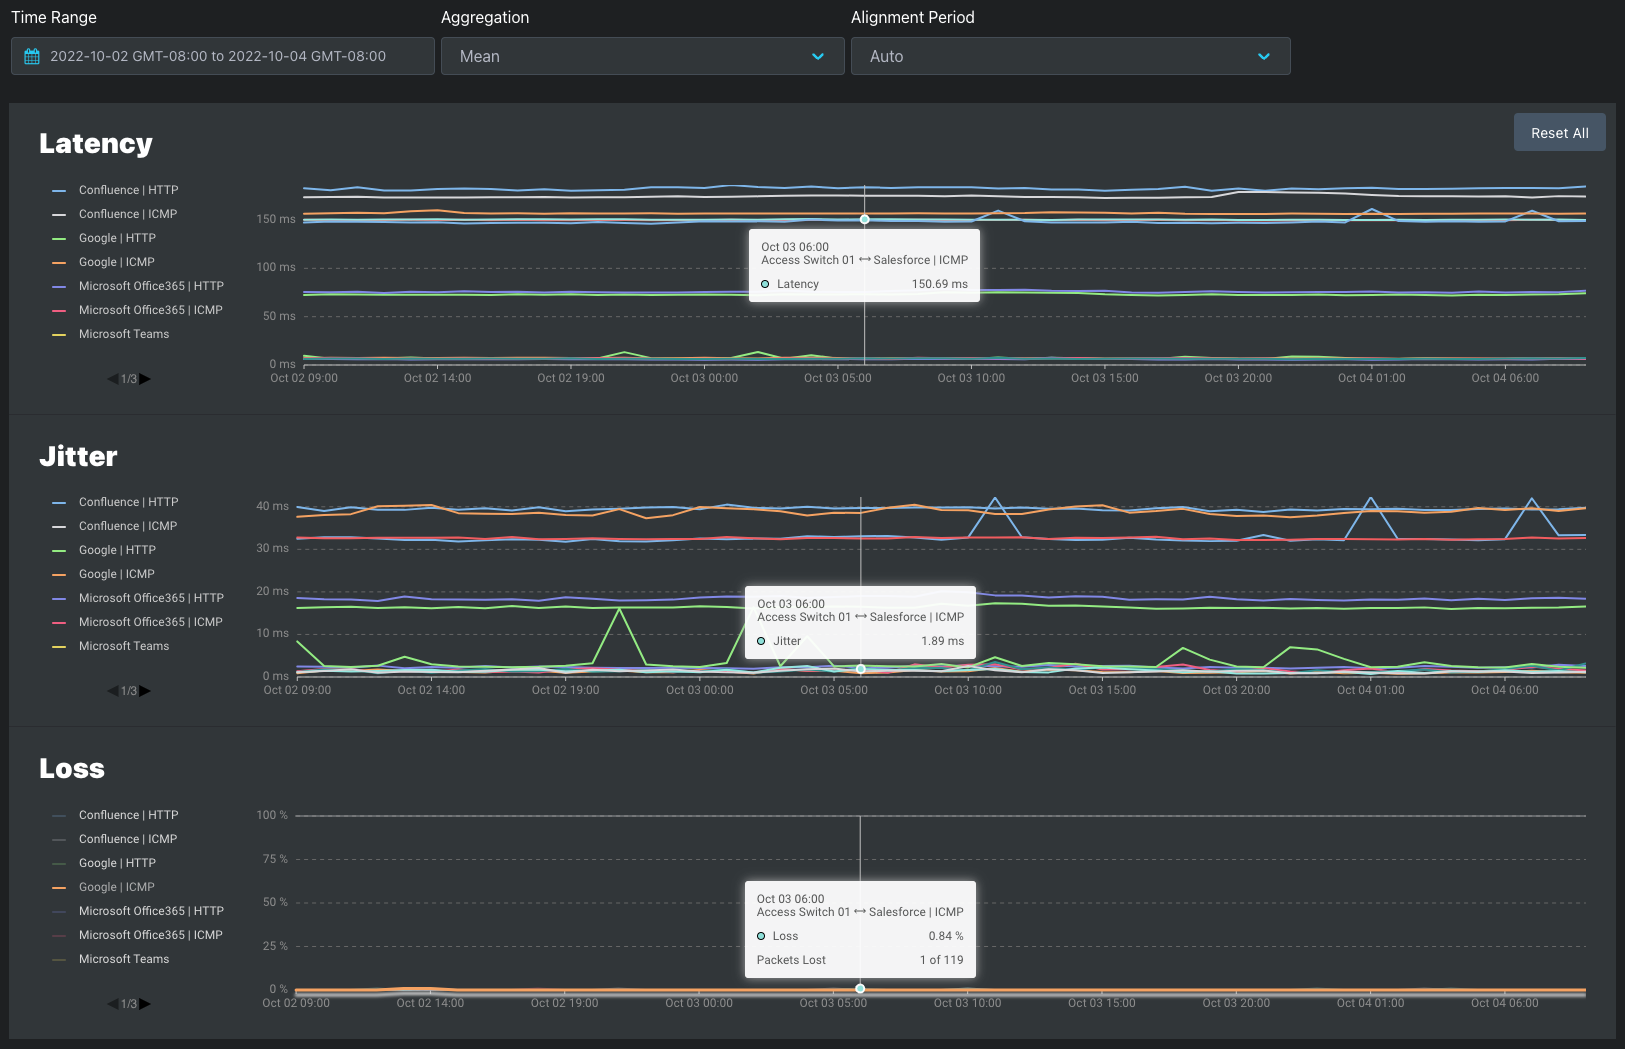
Latency
Jitter
Loss
| Timeout | Out of Order Packets | |
|---|---|---|
ICMP |
| Out of order packets are always considered as packet loss |
UDP | Response not received within 5 seconds is considered loss | N/A - Packet order not considered for packet loss |
HTTP and speed test targets do not report packet loss. This changes how metrics are displayed in the Dashboard:
HTTP availability refers to consistent and reliable access to web resources through the Hypertext Transfer Protocol (HTTP). In the context of websites and web services, availability is a crucial aspect of providing a seamless user experience. Monitoring HTTP timing shows performance bottlenecks in client-to-server or server-to-server communications.
Service Experience Insights monitors the network quality from the agent to the host server but does not provide application monitoring.
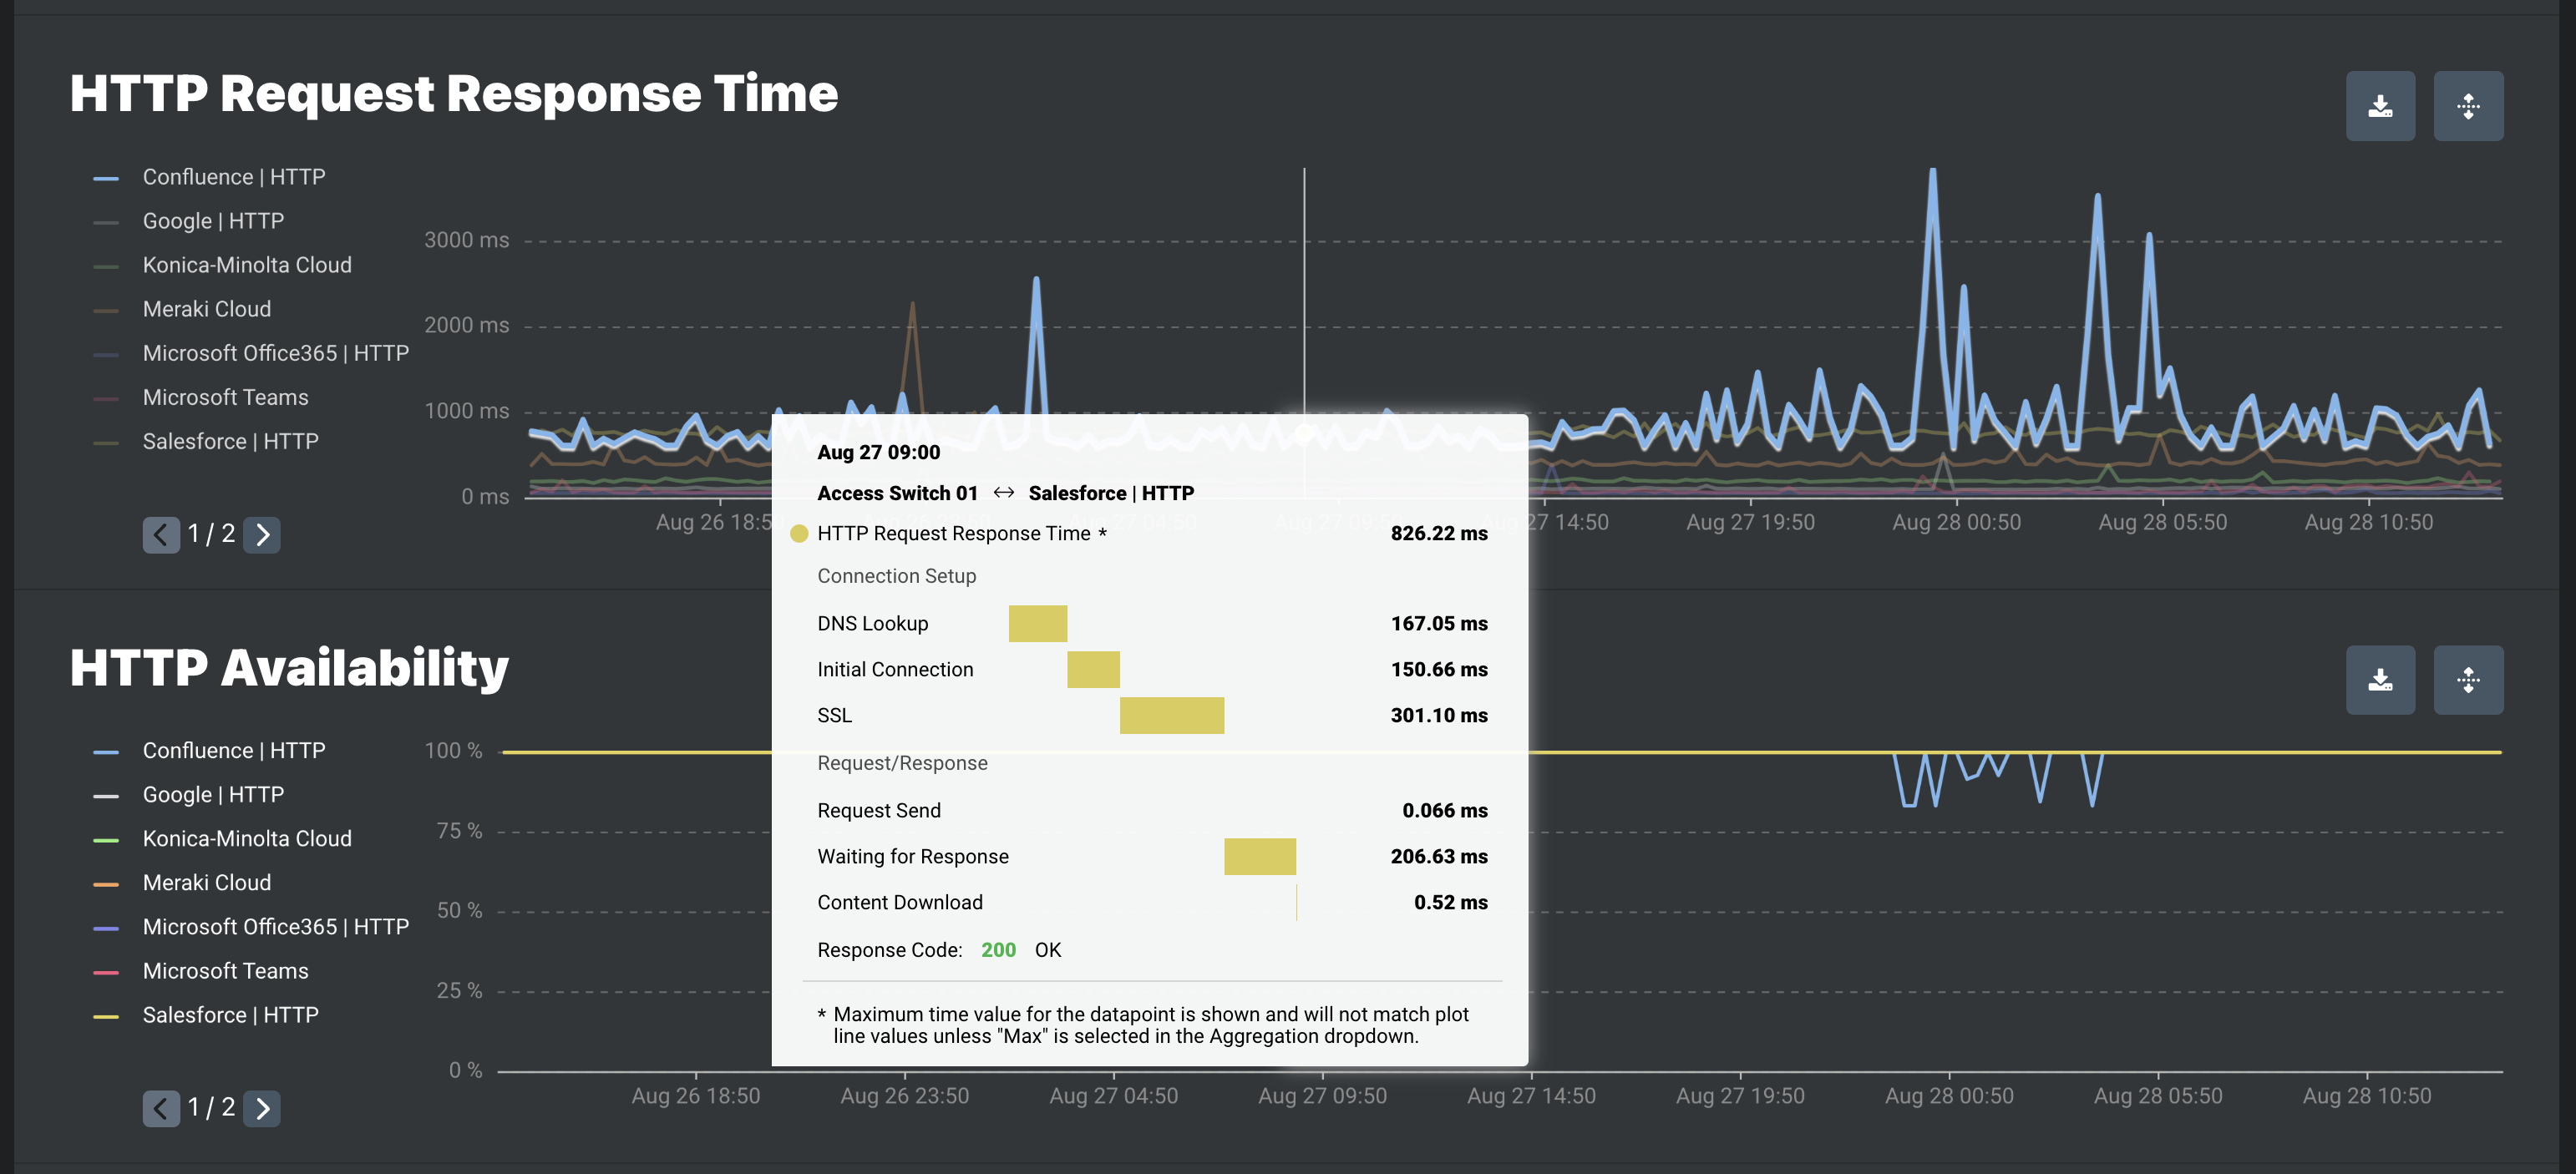
HTTP Request Response Time
| Tool Tip Item | On-Demand Troubleshooting Item | Description |
|---|---|---|
| HTTP Request Response Time | Total response time | Total time for the complete HTTP request. |
| Connection Setup | ||
| DNS Lookup | DNS Lookup | Time spent performing the DNS lookup. DNS lookup resolves domain names to IP addresses. Every new domain requires a complete round trip to do the DNS lookup. There is no DNS lookup when the destination is already an IP address. |
| Initial Connection | TCP Connect | Time to establish a TCP connection between a source host and destination host. Connections must be properly established in a multi-step handshake process. TCP connection is managed by an operating system. If the underlying TCP connection cannot be established, the OS-wide TCP connection timeout will overrule the timeout config of our application. |
| SSL | TLS Handshake | Time to complete a TLS handshake. During the handshake process, endpoints exchange authentication and keys to establish or resume secure sessions. There is no TLS handshake with a non-HTTPS request. |
| Request/Response | ||
| Request Send | Request send | Time to send the first request |
| Waiting For Response | TTFB | Time to first byte after the request is sent. |
| Content Download | Content download | Time spent receiving the response data. The size of the response data and the available network bandwidth determine its duration. |
| Response Code | Response Code | Response code returned in the response header. |
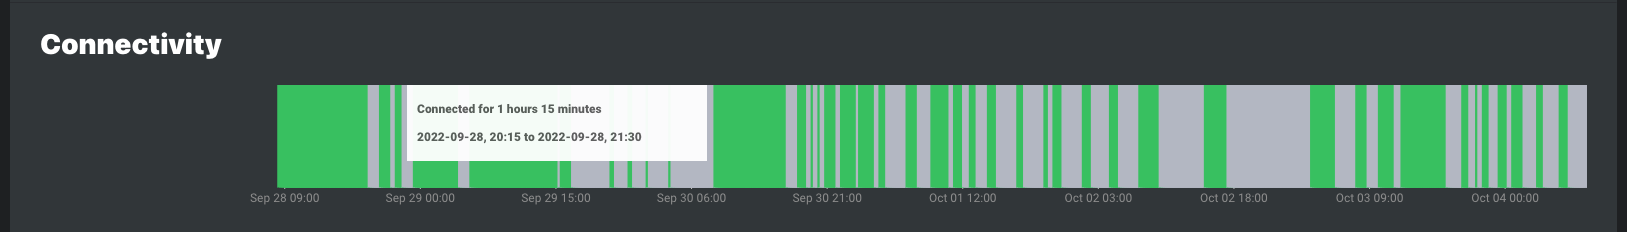
HTTP Availability

Red indicates when static and cloud agents were disconnected

Gray indicates when mobile agents were disconnected. Gray is used for mobile agents because they are expected to be offline when the host PC is not in use
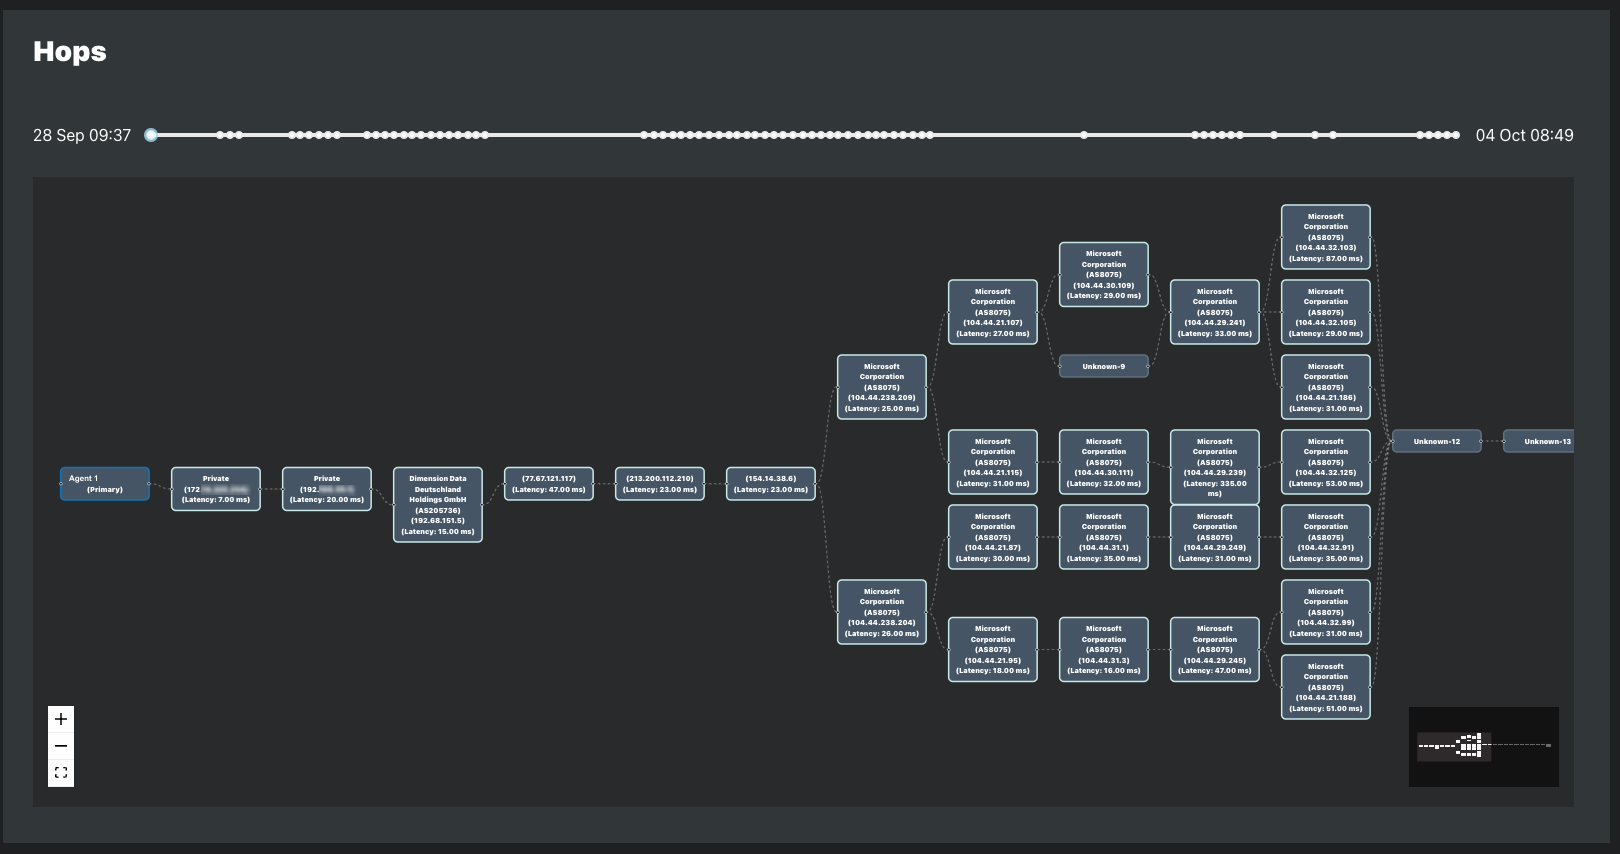
Agents perform path discovery when the agent is added to a probing distribution with path discovery enabled.
Path probing, also referred to as path probing, actions are used to create path discovery visualizations of the hops between the agent and the target. The path discovery visualization shows the IP and latency of each hop and the carrier ASN in use at the time.
Automatic path probing is performed during each path discovery interval and when a change in target latency or IP is detected. Manual path discovery can be triggered with on-demand troubleshooting. Learn more about how agents perform path discovery path probing in the Agents Overview article.
For agents in a path discovery probing distribution, clicking a target plotline opens the path visualization for the alignment period and time range selected.
Path Discovery Methodology
Path Probing Concept
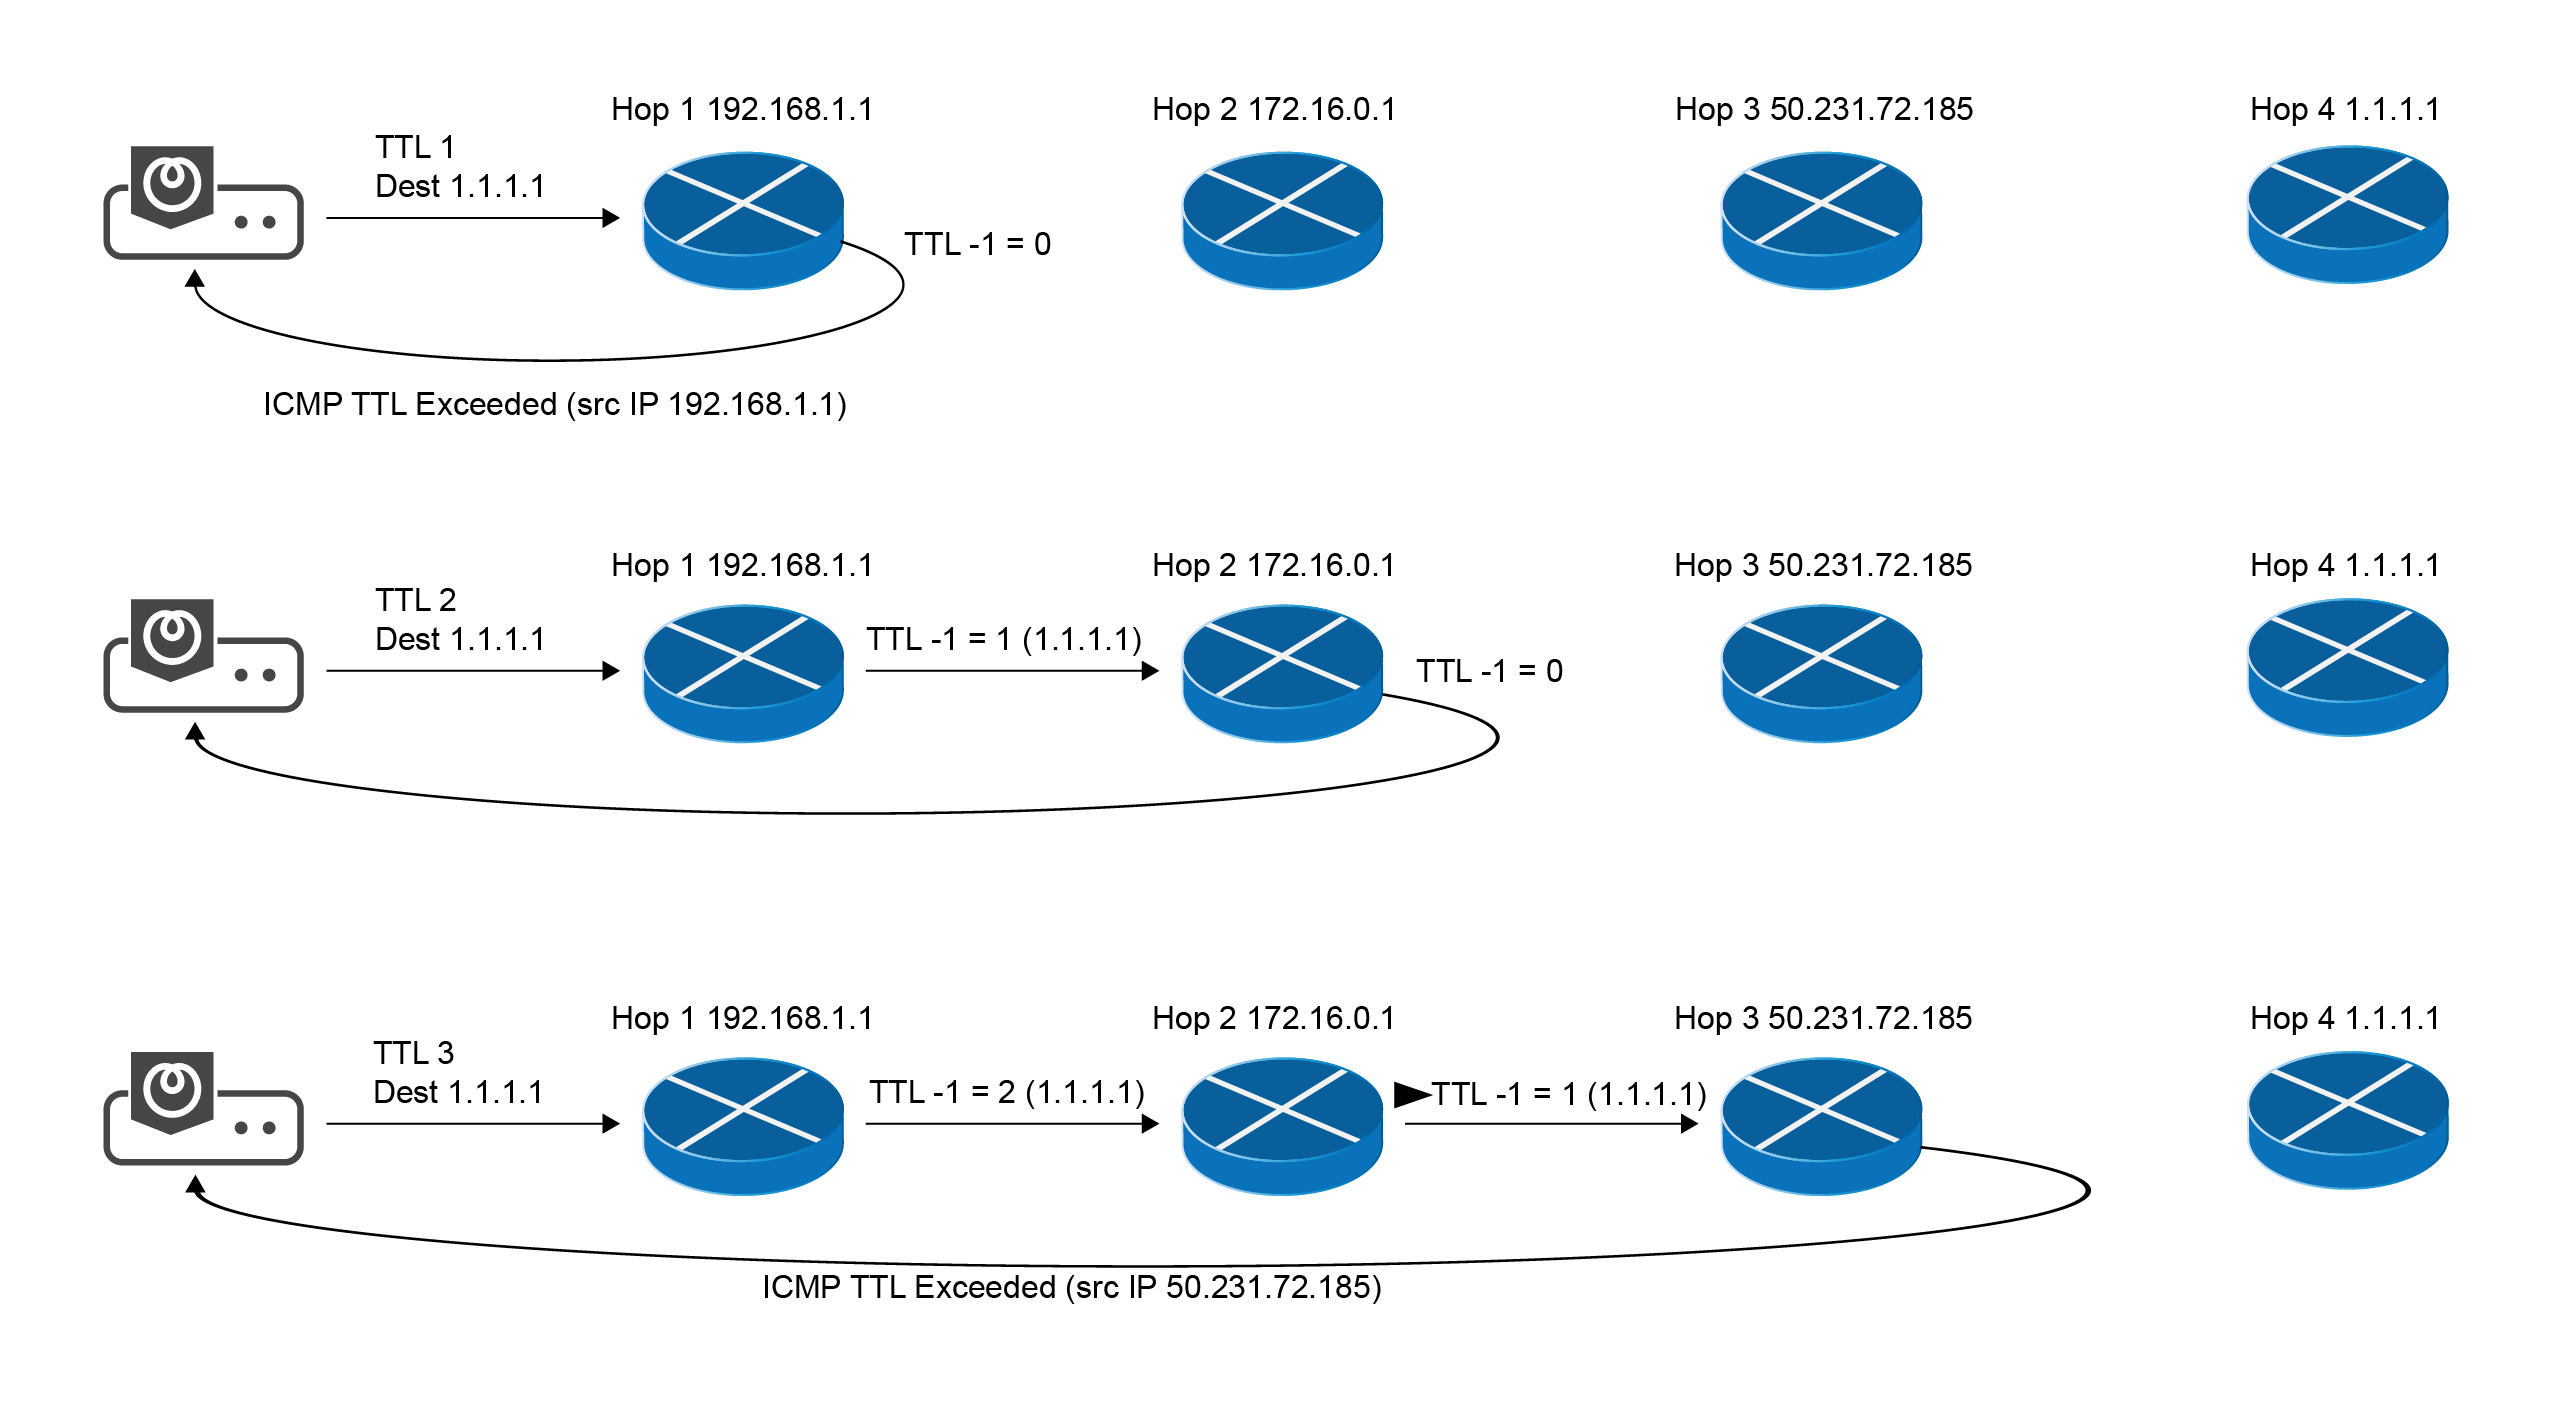
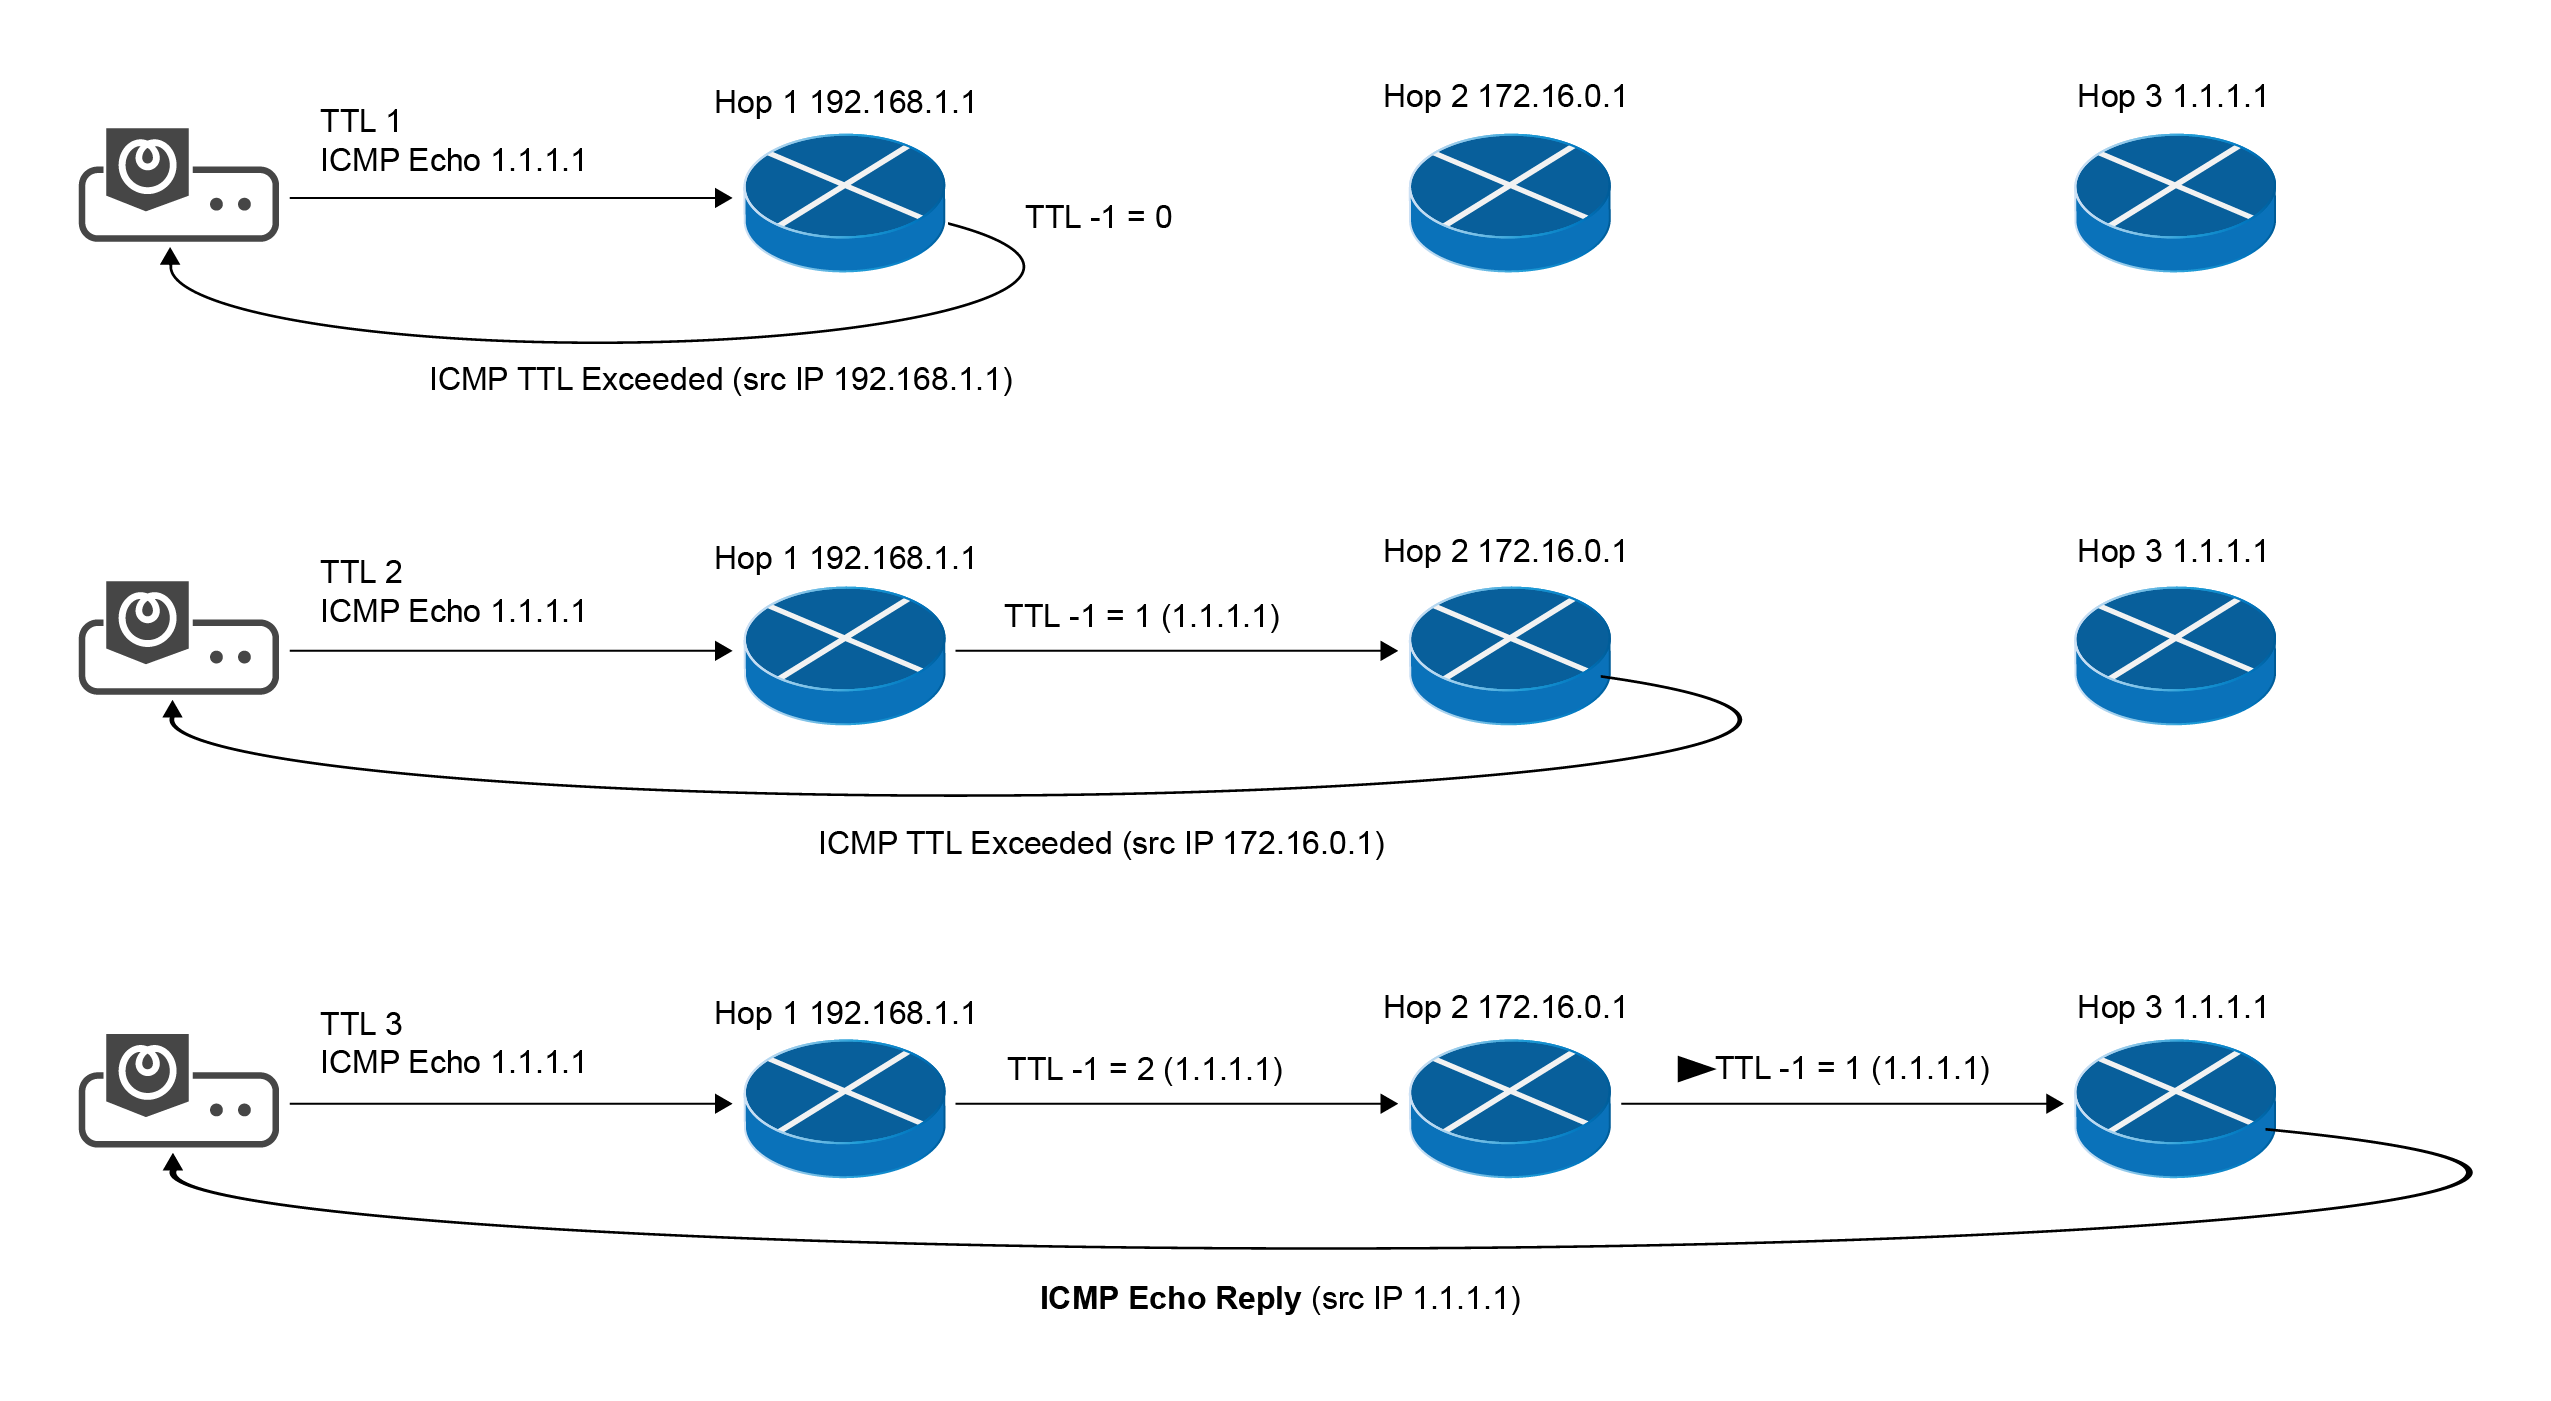
ICMP Path Probing
ICMP echo request message is sent to the target host with incrementing TTL
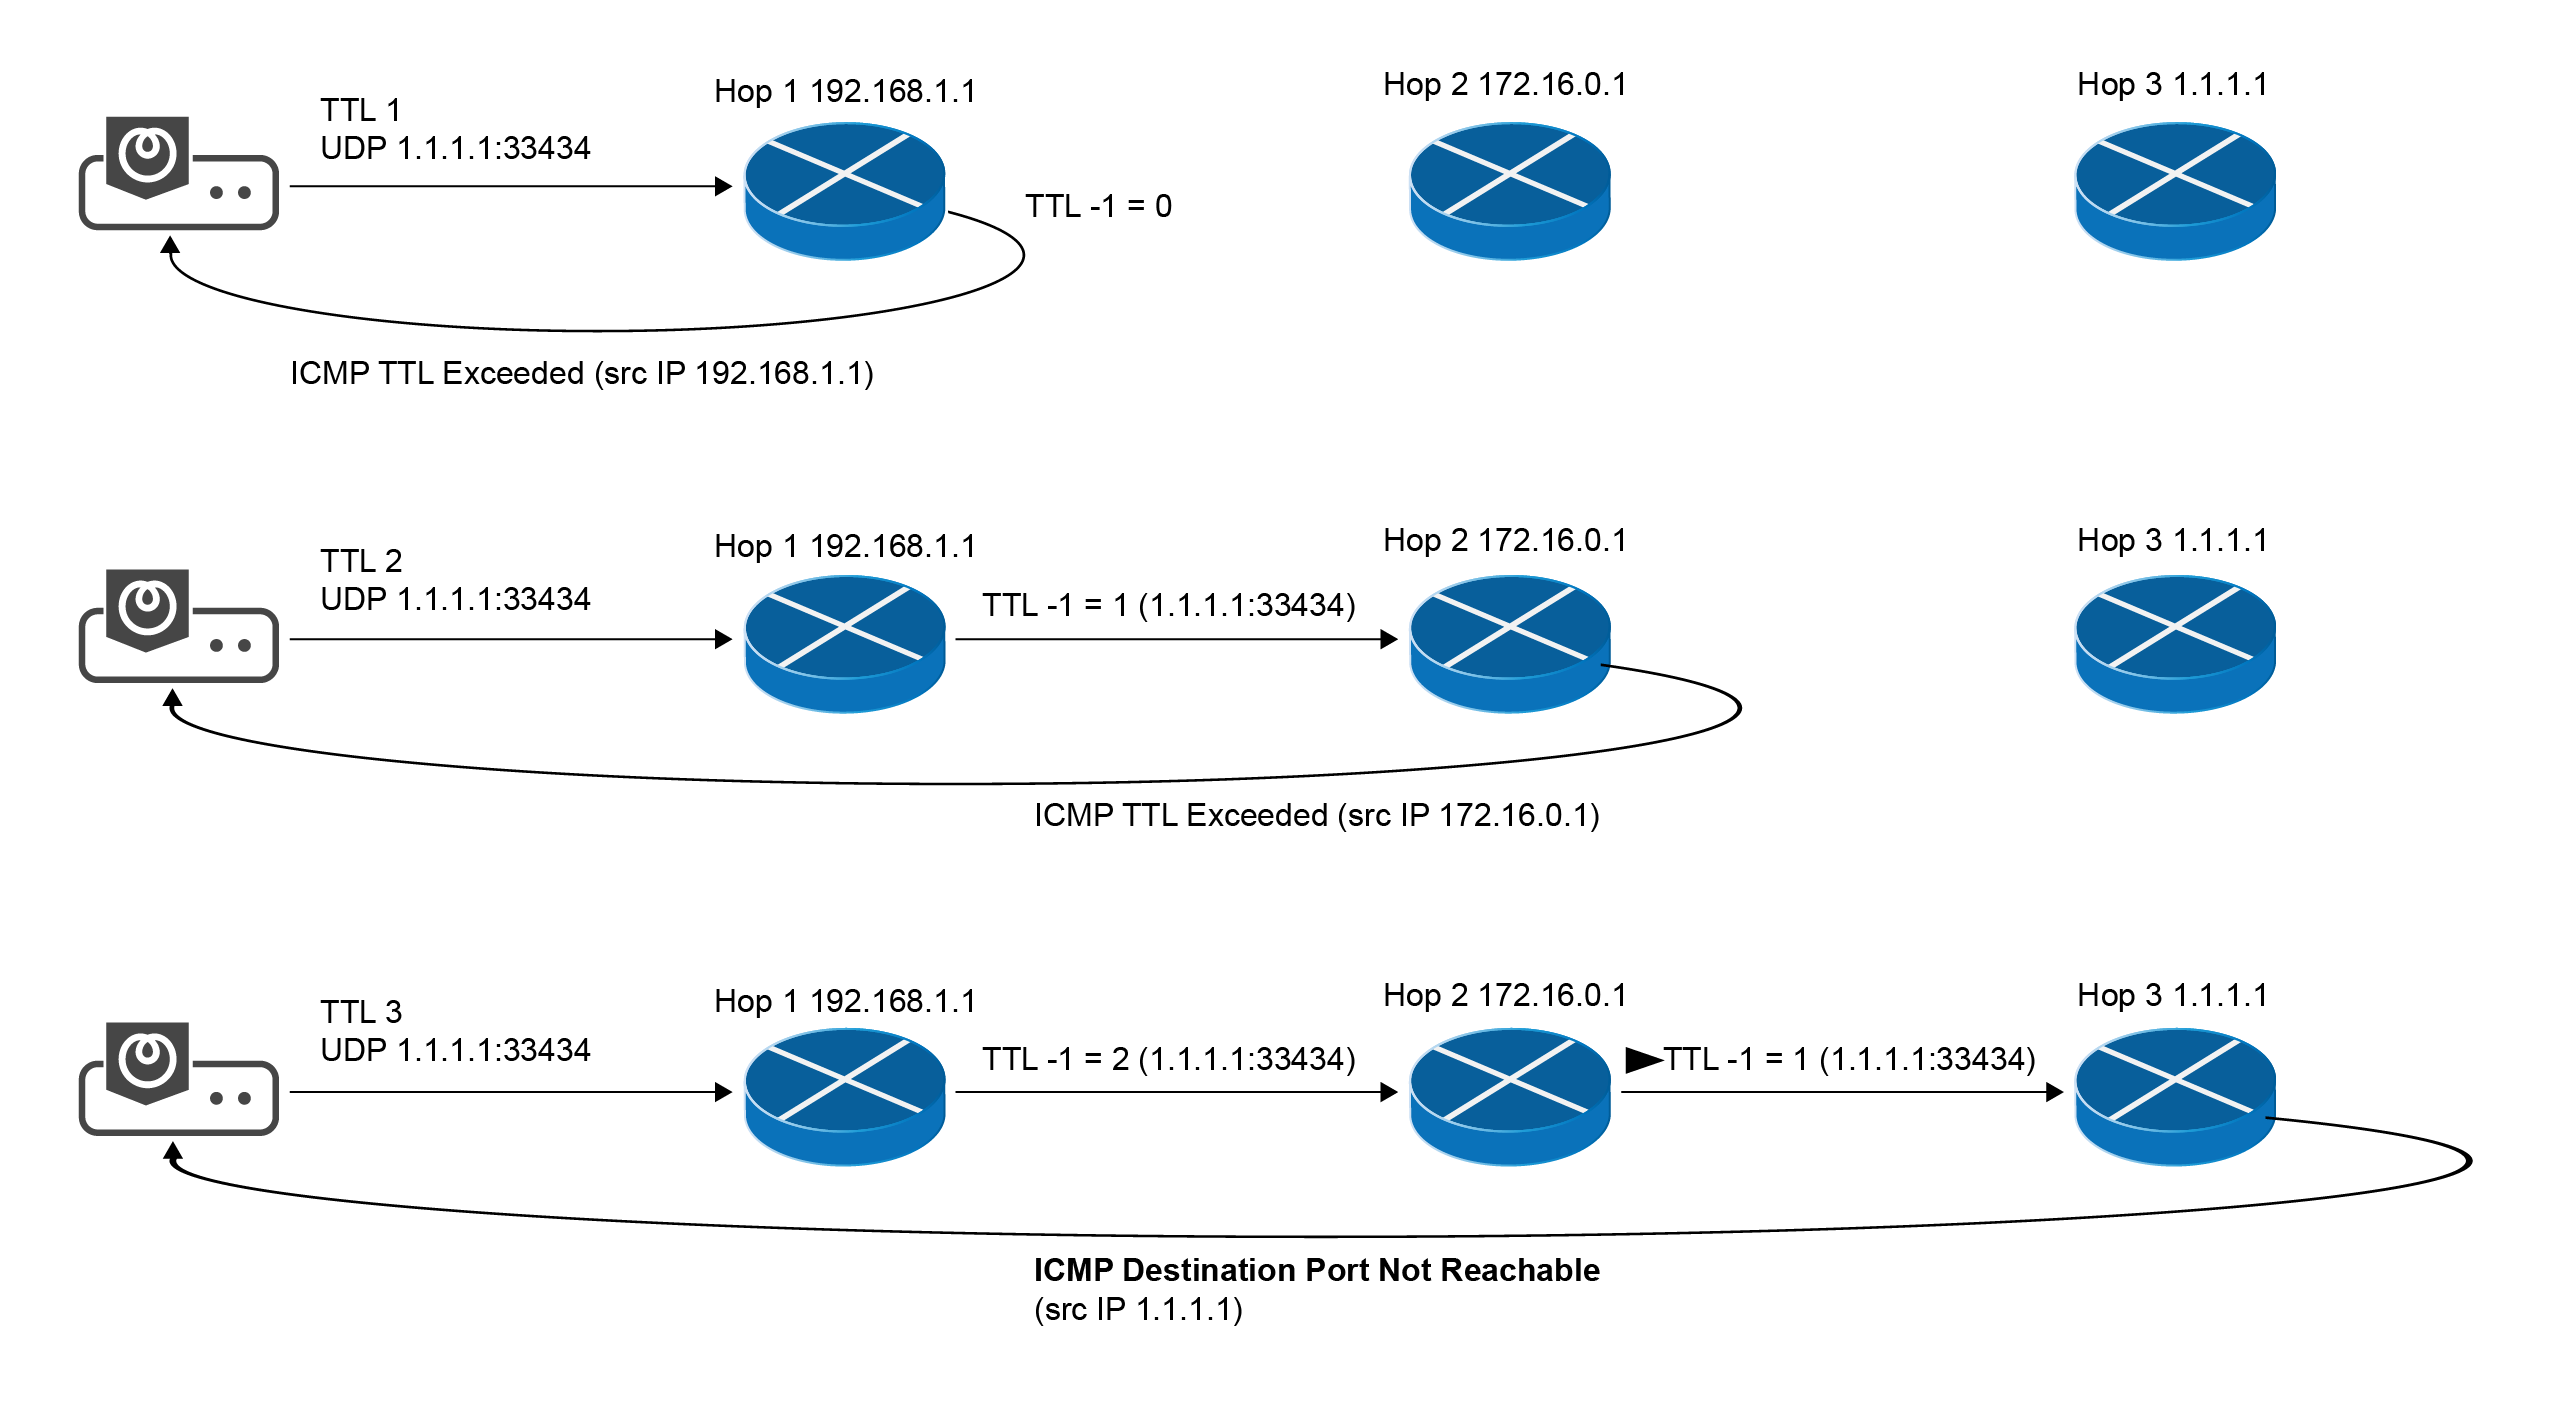
UDP Path Probing
TCP Path Probing
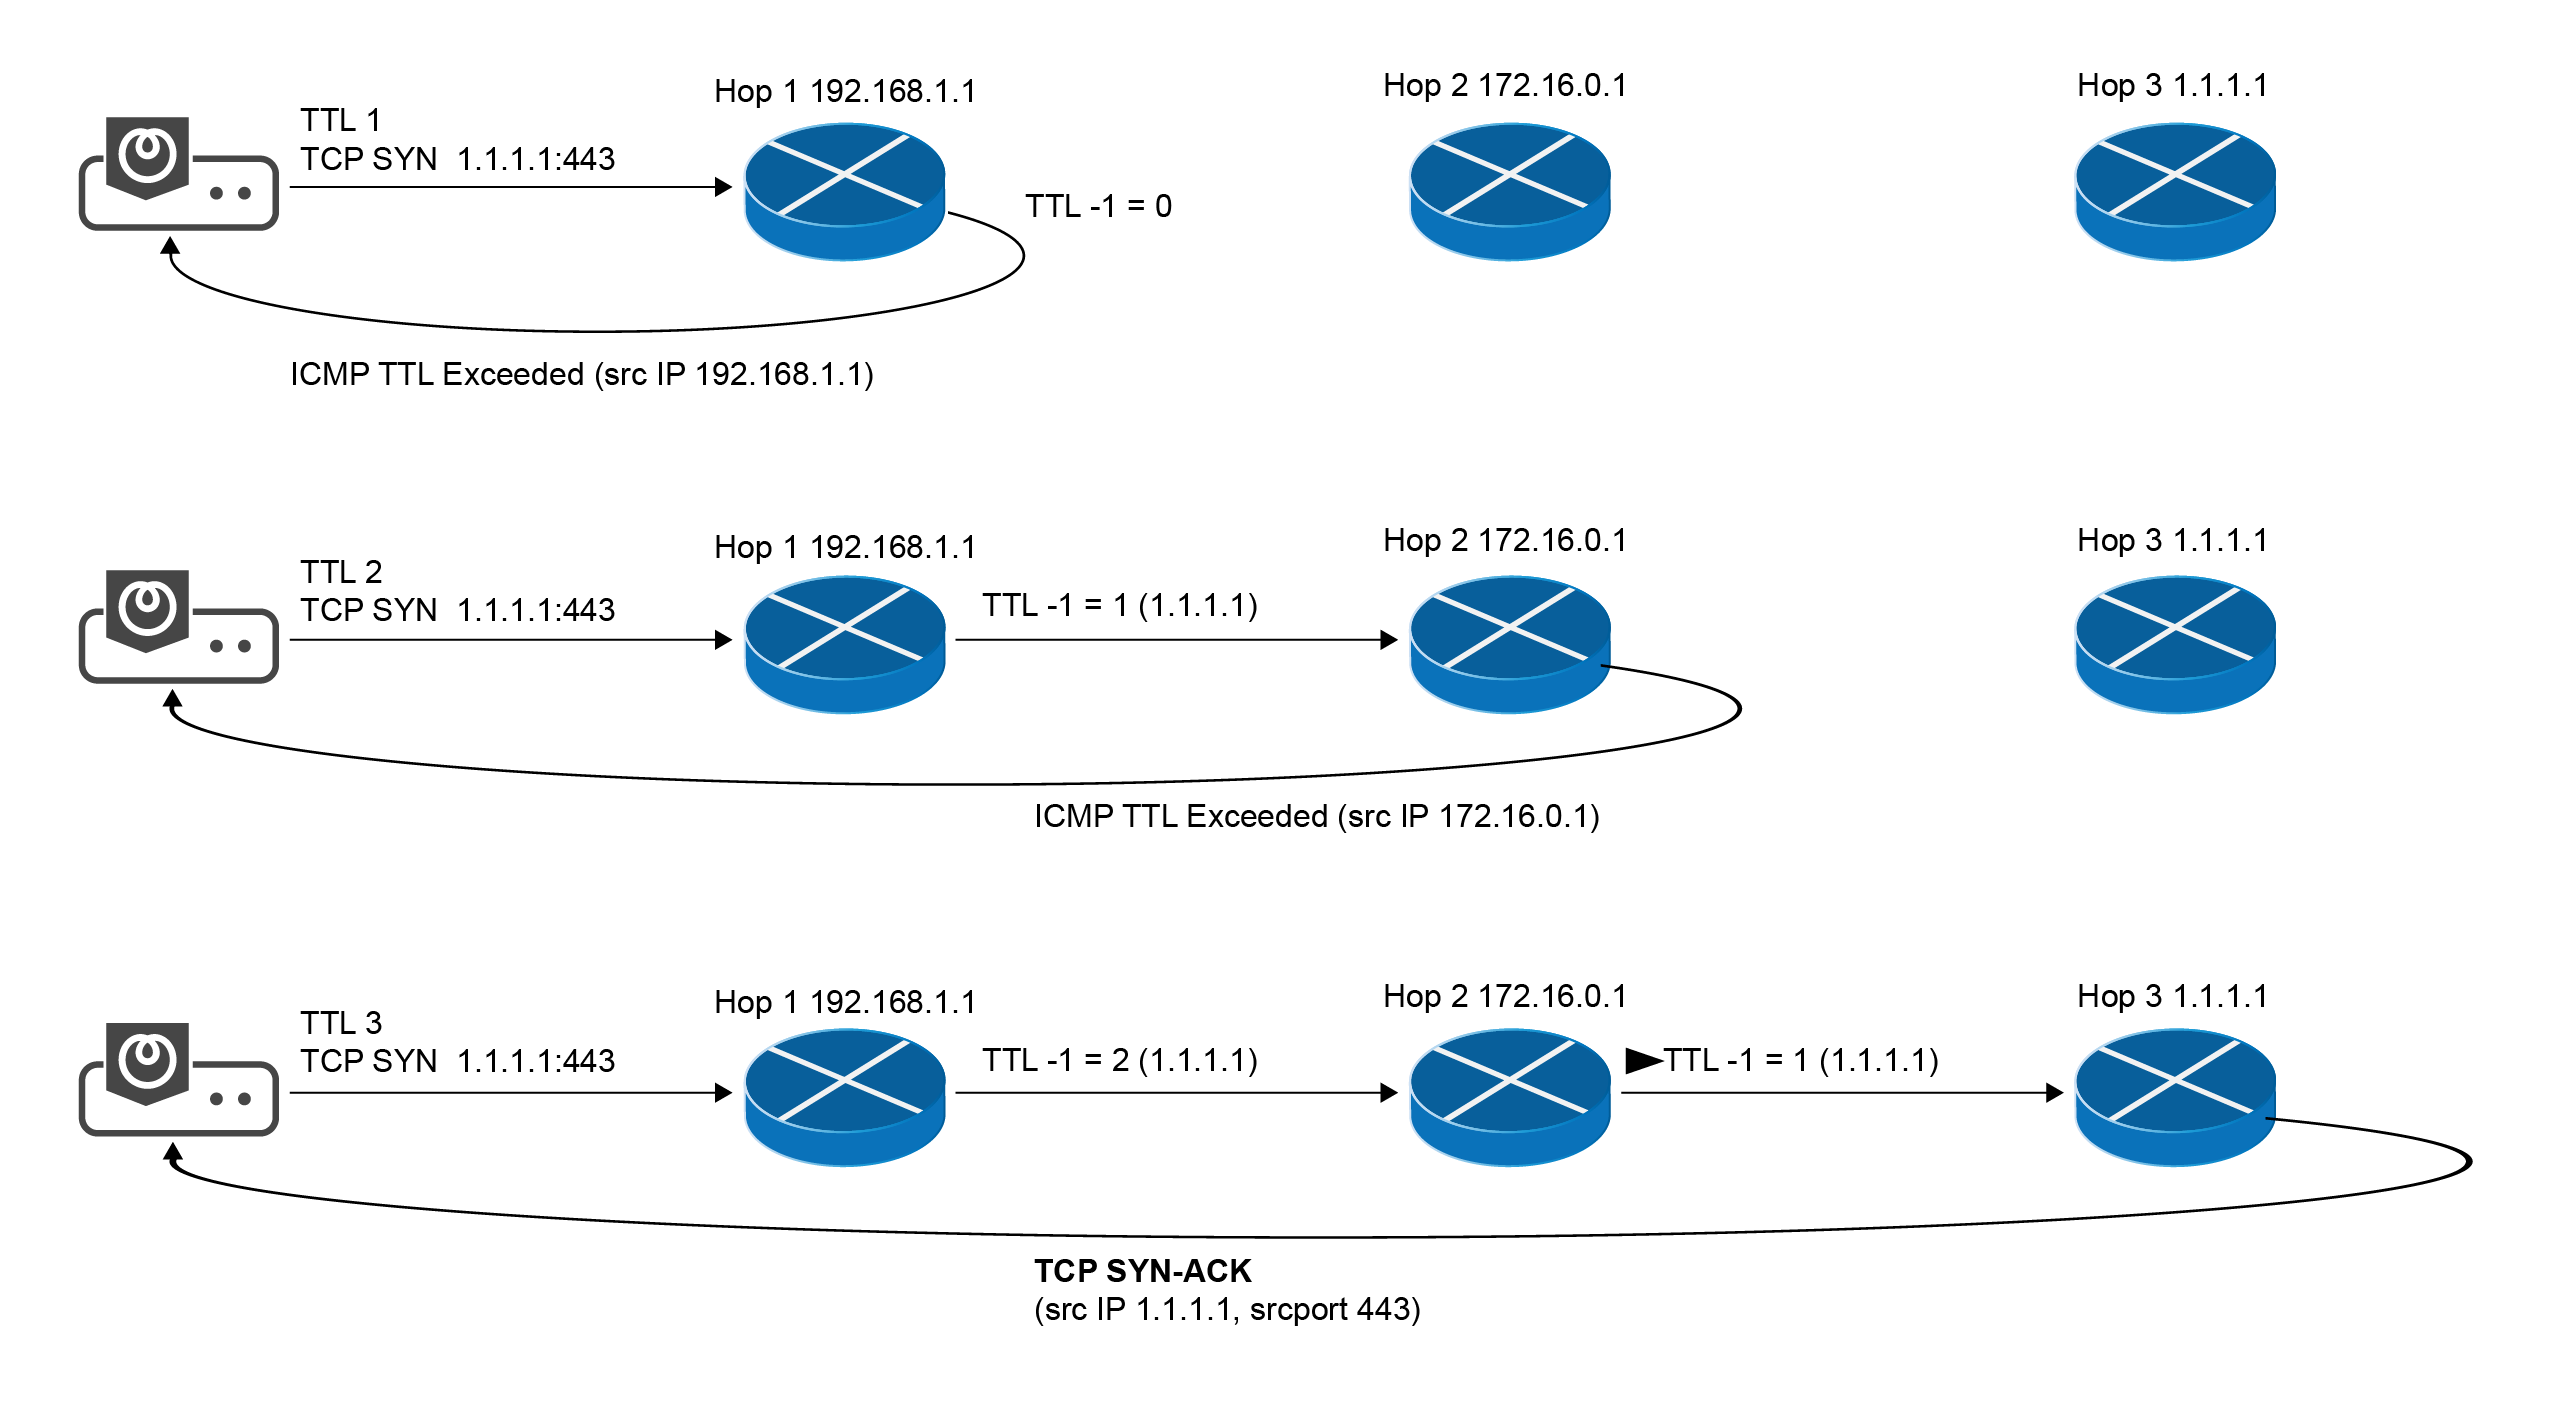
TCP Path Probing (Privileged)
Configure firewalls to allow path probing
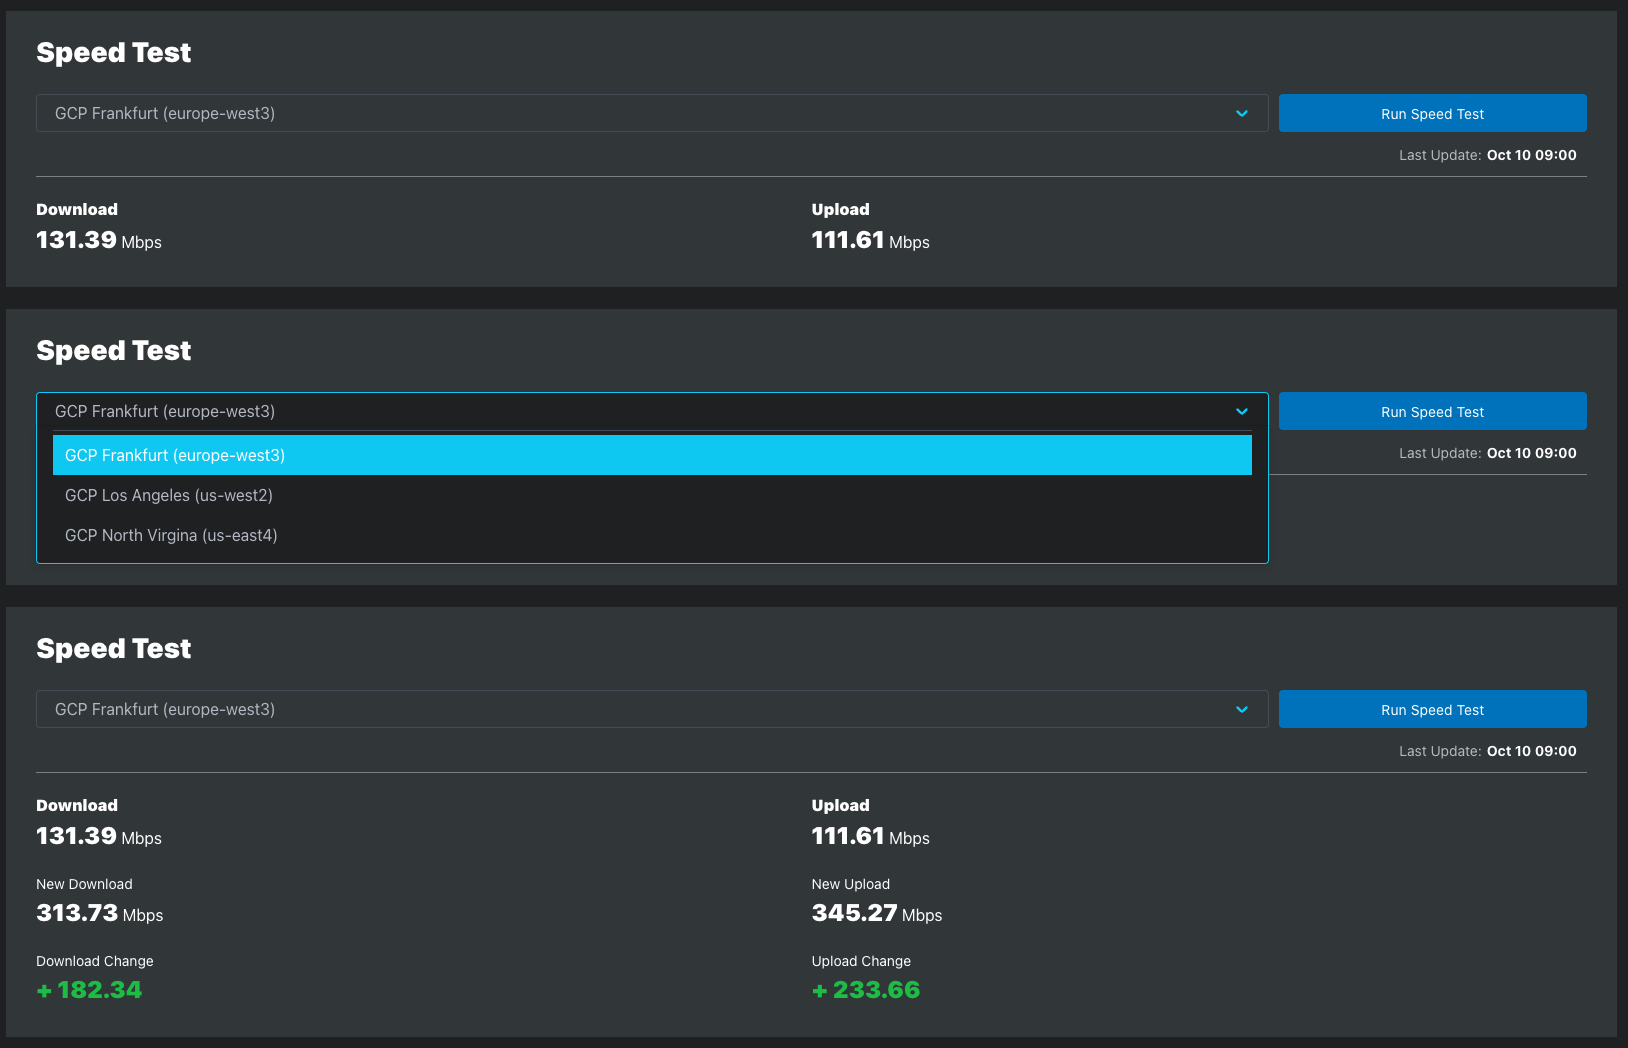
See the Data Usage Estimation to learn more about the bandwidth consumed by speed tests.
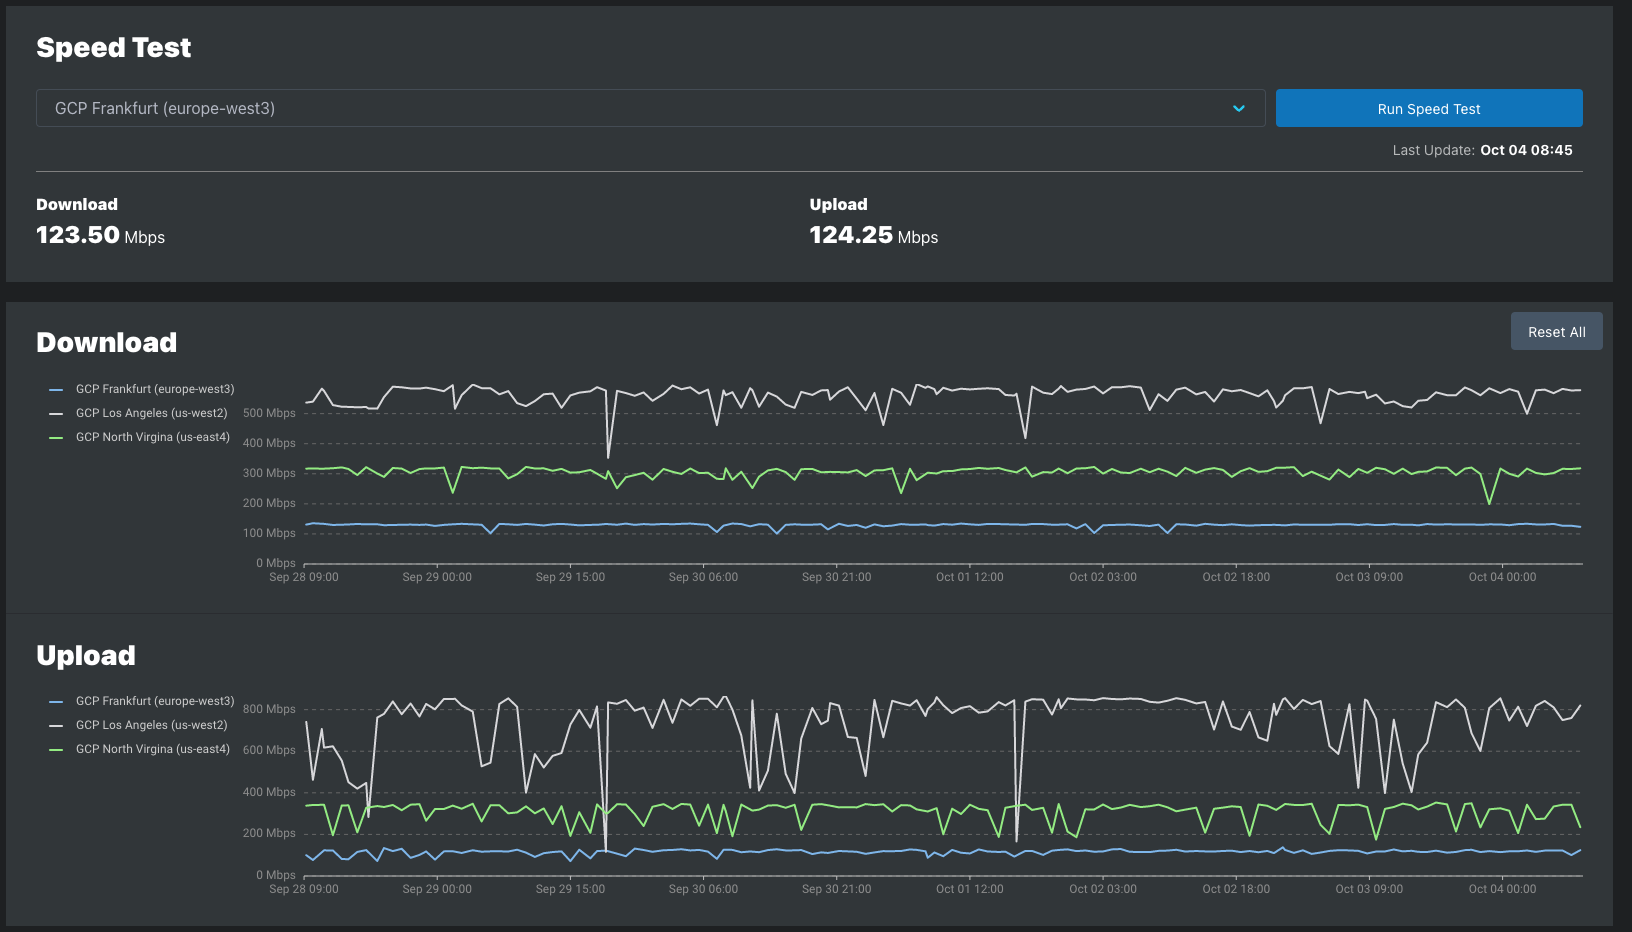
Example of on-demand Speed Tests
| Metric | Description |
|---|---|
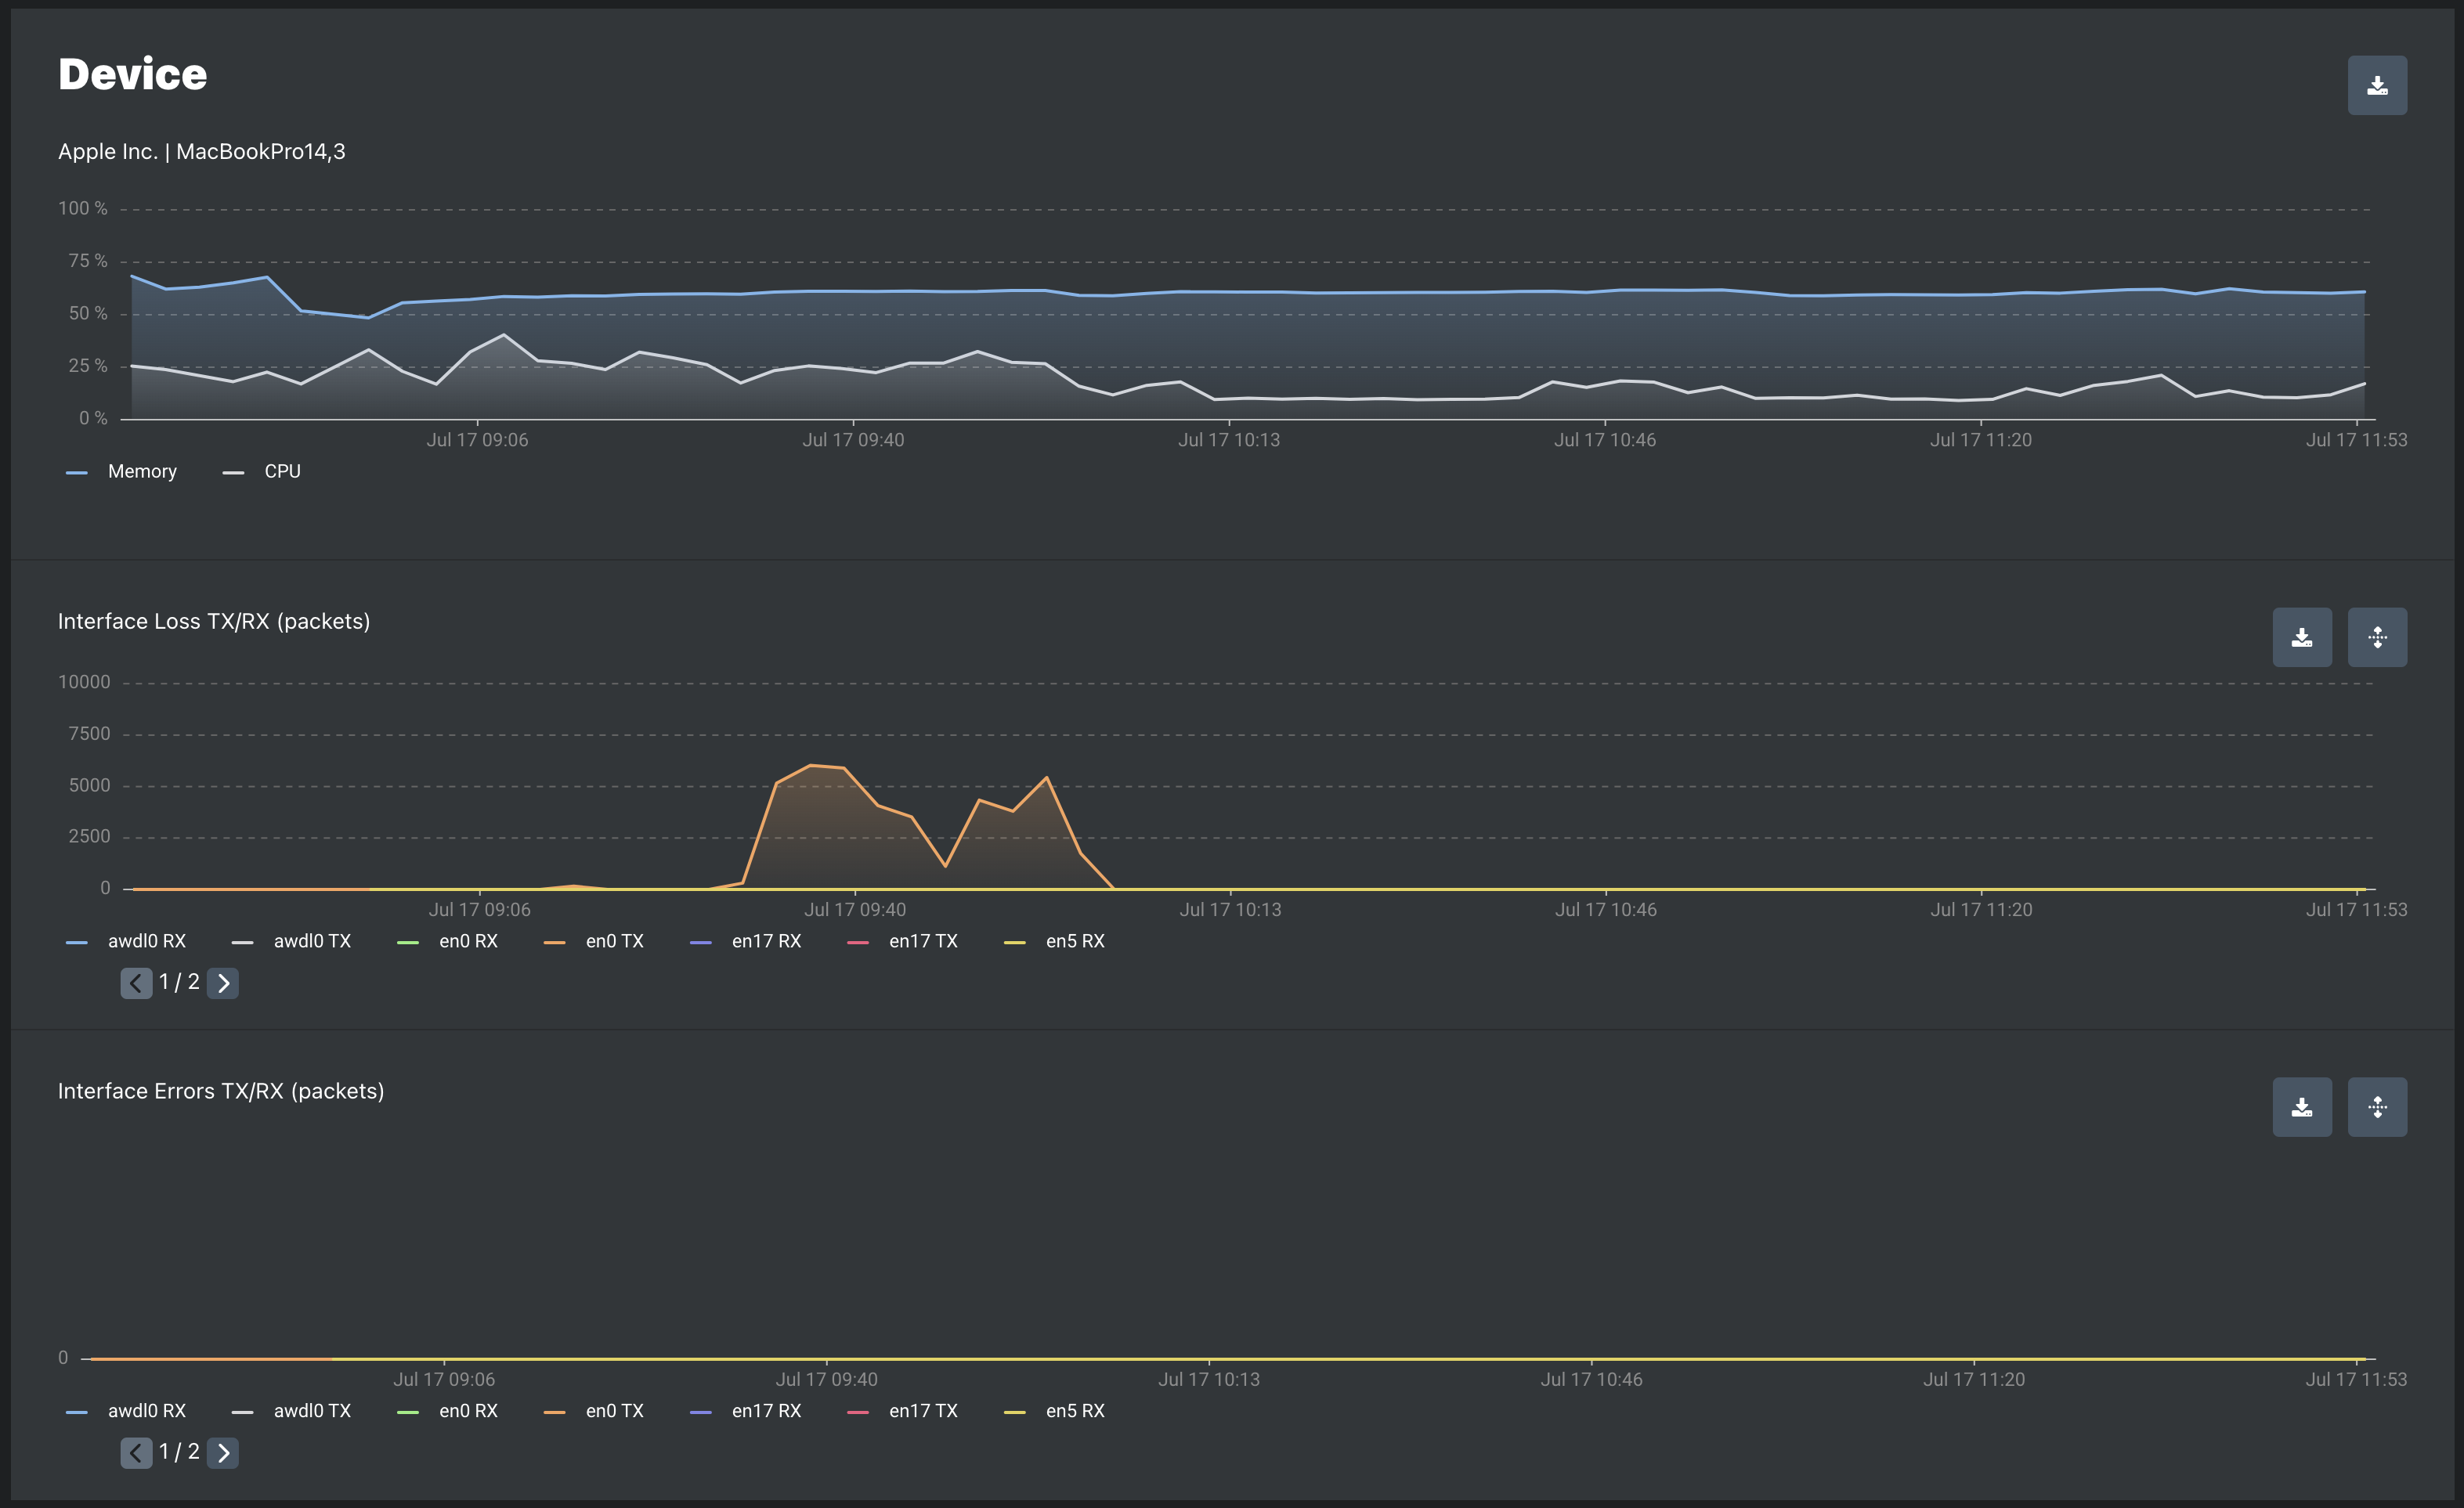
Interface Loss TX | The number of outbound packets which were discarded even though no errors had been detected to prevent their being transmitted. One possible reason for discarding such a packet could be to free up buffer space. |
Interface Loss RX | The number of inbound packets which were discarded even though no errors had been detected to prevent their being deliverable to a higher-layer protocol. One possible reason for discarding such a packet could be to free up buffer space. |
Interface Errors TX | The number of incoming packets that were discarded because of errors. Examples of possible scenarios that cause this could be a duplex mismatch, CRC mismatch etc. |
Interface Errors RX | The number of outgoing packets that were discarded because of errors. One possible scenario that causes this could be a duplex mismatch. |
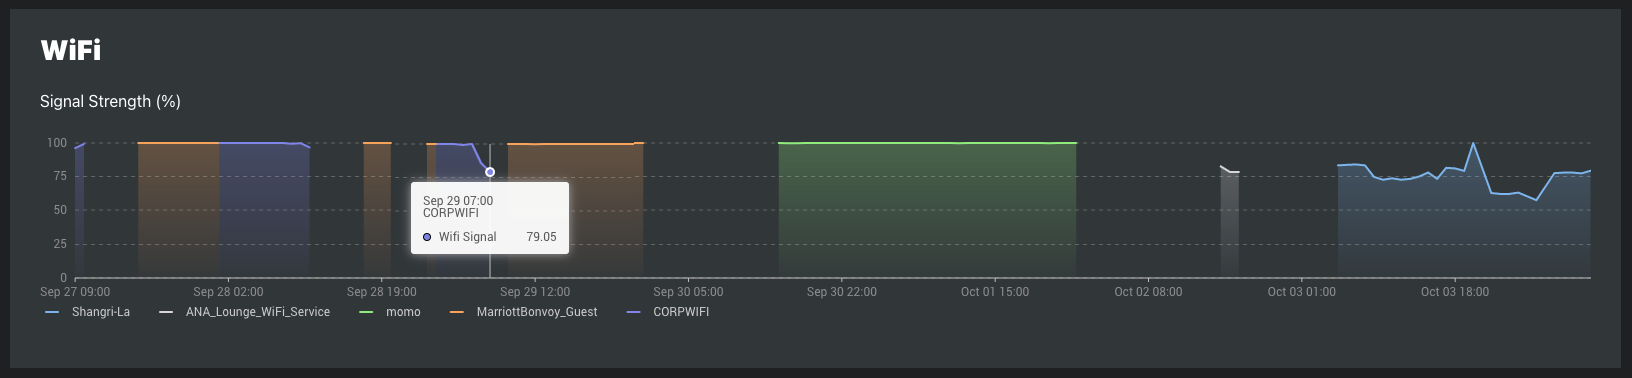
WiFi Signal Strength is reported for agents connected to a WiFi access point, regardless of how the agent connects to the controller (Ethernet, WiFi, or cellular).
WiFi Data Collected by SEI Agents:
Representation in SEI Dashboards:
The SEI Dashboards Agent page WiFi Signal Strength plot displays WiFi signal strength using the Quality Percentage (%).
WiFi Signal Strength Calculation by Agent Type:
Agent data collection and aggregation
| Data points per metric | Probing Interval | |
|---|---|---|
| 60 seconds | 1 second | |
| Loss | 1 | 60 |
| RTT | 1 | 60 |
| Test Values | 2 | 120 |
| Metrics | Metric Values | |||||
|---|---|---|---|---|---|---|
| Mean | Median | Max | 95th Percentile | 99th Percentile | ||
| Latency | 1 | 1 | 1 | 1 | 1 | |
| Jitter | 1 | 1 | 1 | 1 | 1 | |
| Loss | 1 | 1 | 1 | 1 | 1 | |
| Metric Values Per Minute | 3 | 3 | 3 | 3 | 3 | |
| Metric type | Shortest/Most Frequent | Longest/Least Frequent |
|---|---|---|
| ICMP | 1 second | 10 minutes |
| UDP | 100ms | 10 minutes |
| HTTP | 30 seconds | 10 minutes |
| Speed Test | Defined hourly probing intervals | 1, 6, 12, or 24 hours |
Metrics values in the time series database
| Age of data | Alignment Period |
|---|---|
| 1 minute to 14 days | 1 minute |
| 15 to 28 days | 3 minutes |
| 29 to 42 days | 5 minutes |
| 43 to 184 days | 1 hour |
| 185 to 366 days | 3 hours |
| 367 to 732 days | 6 hours |
| 733 to 1463 days | 12 hours |
| ≥ 1464 days | 1 day |
Date retention