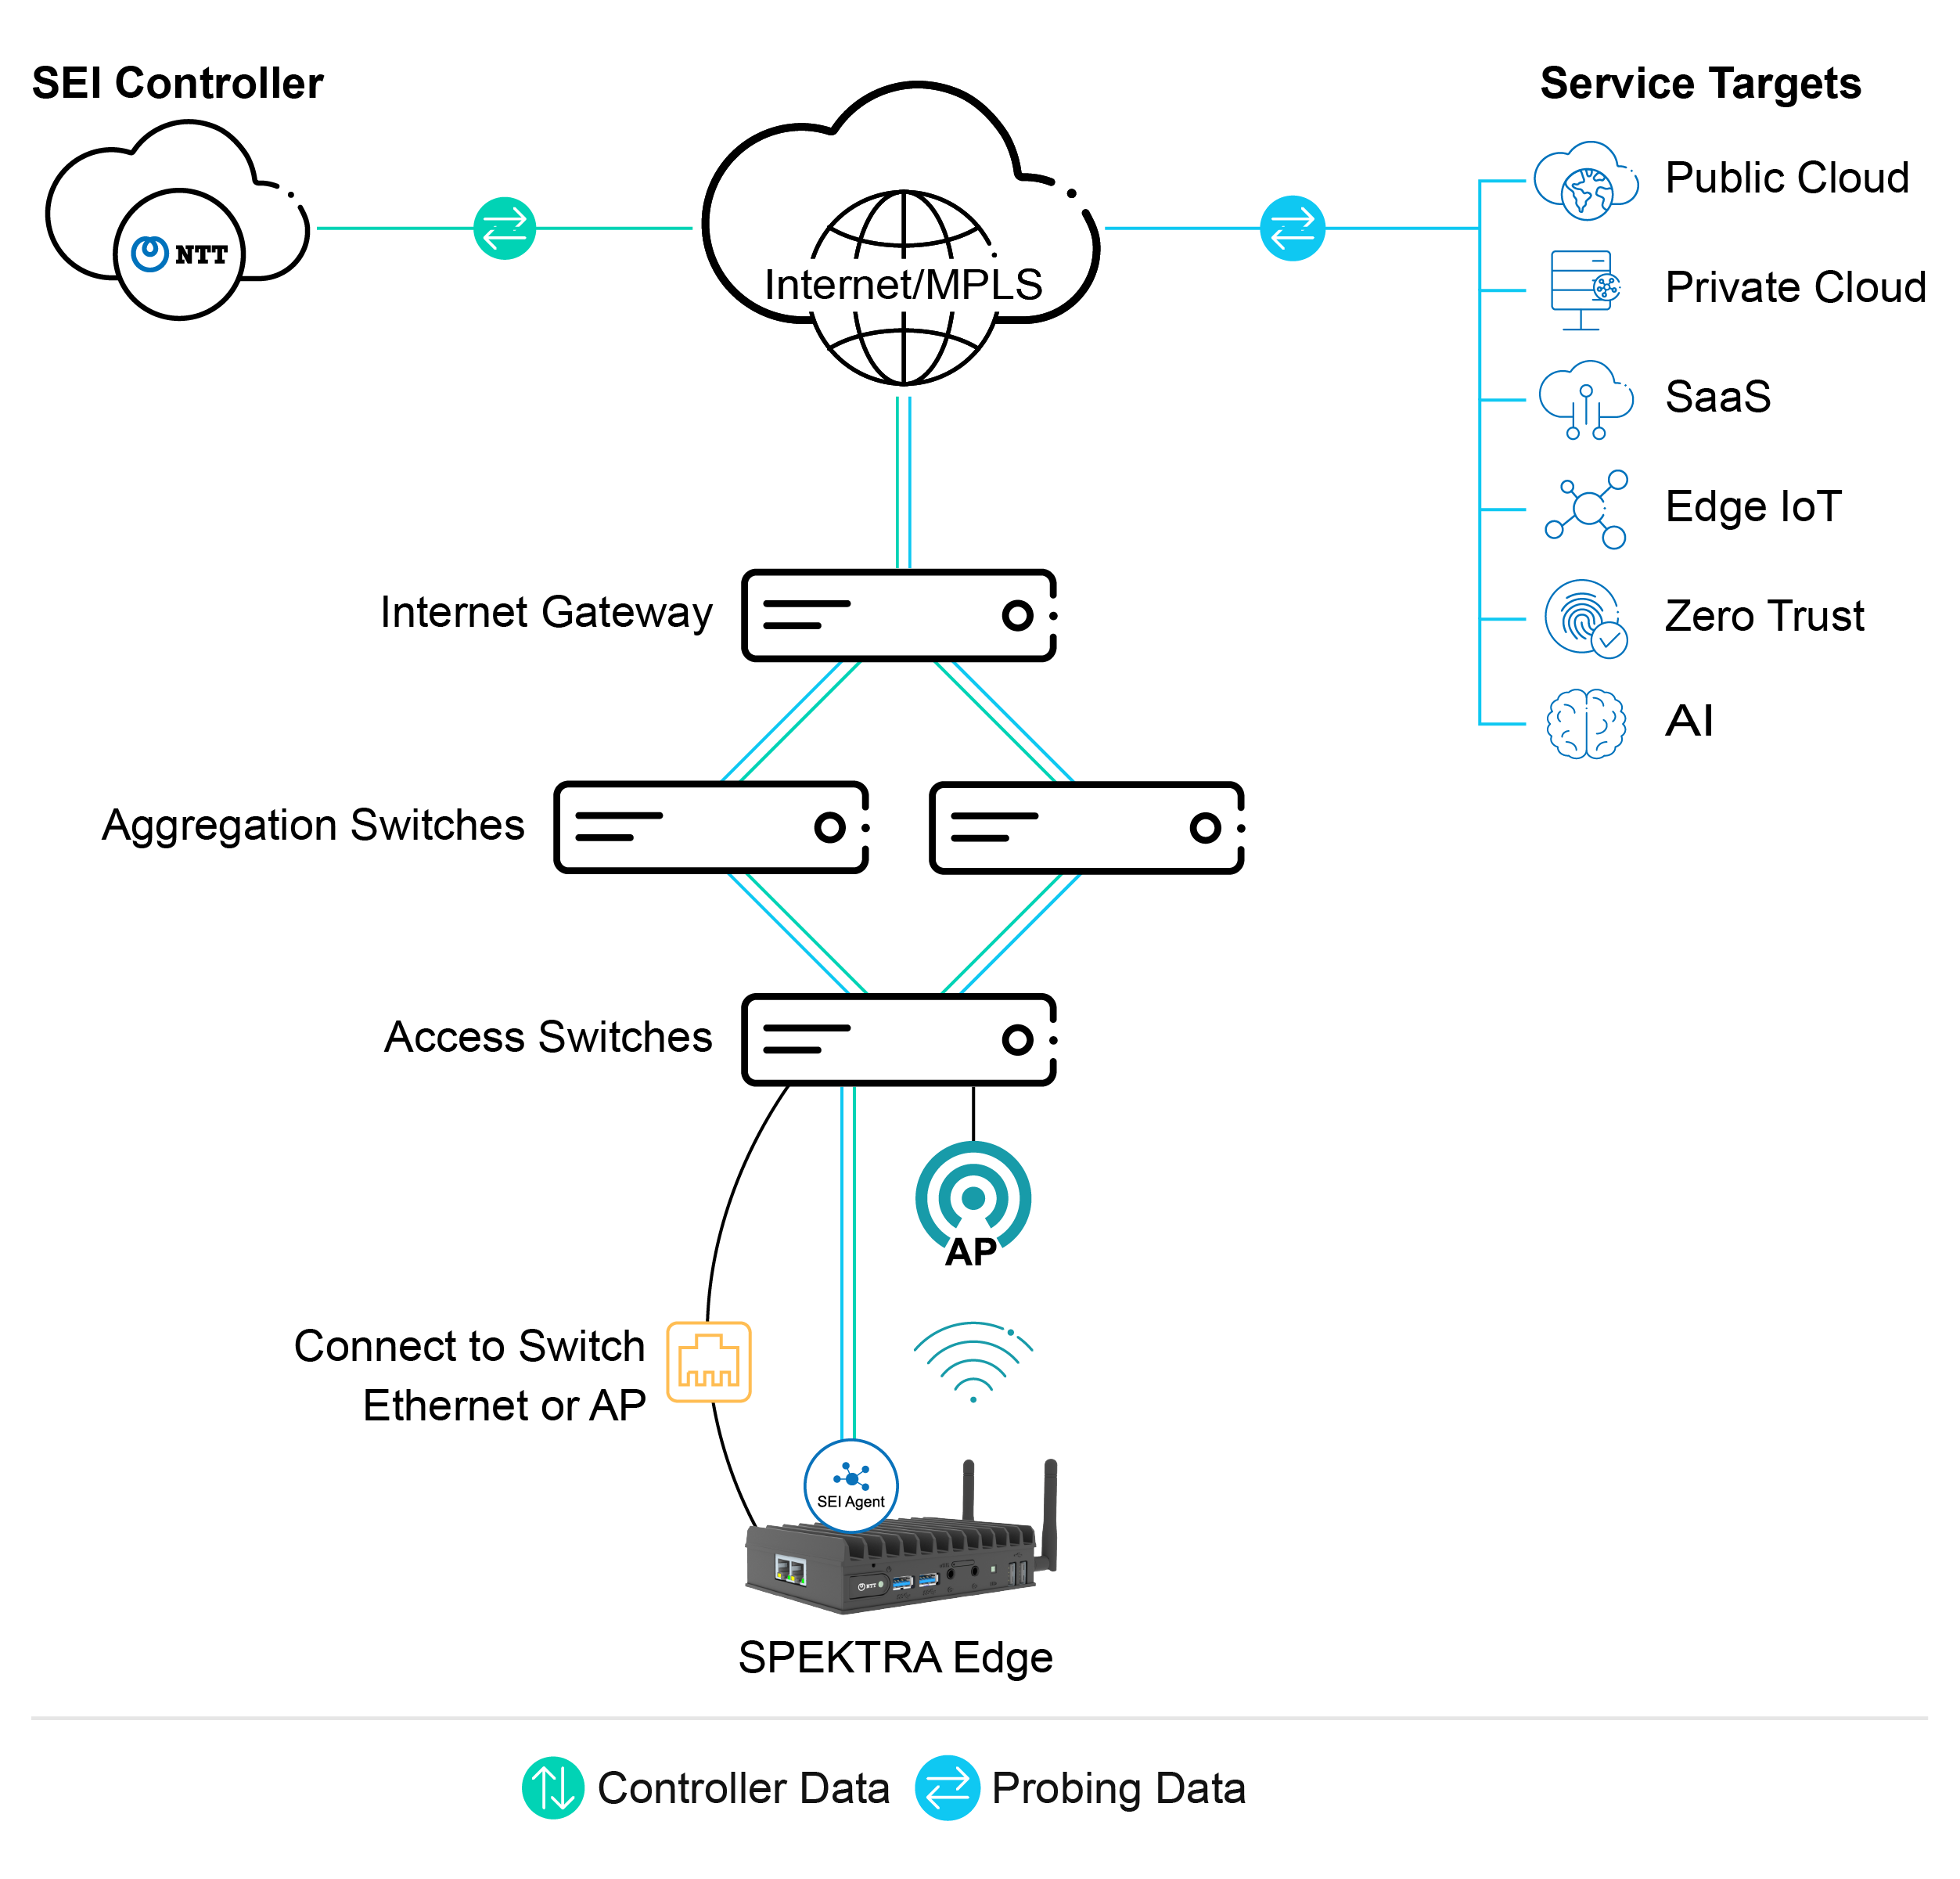
Agents are lightweight probing software deployed to hosts in the network and managed by the cloud-based SEI Controller.
The core function of agents is to:
Agent-to-agent probing is an optional configuration for Static and Cloud Agents. When configured, these agents reply to probing from other agents and are called “managed targets” that can be added to probing distributions.
A variety of agent software is provided to support deployment in heterogeneous network environments.
A variety of agent software is provided to support deployment in heterogeneous network environments.
For dedicated network devices
SPEKTRA Edge appliances and deployed to generic devices running EdgeLQ OS.
For application-hosting network appliances
Deploy in Docker containers to Cisco 9K series application-hosting routers and switches.
For data centers and cloud environments
Deploy to VMs with Docker runtime hosted in public or private cloud environments.
For mobile end-user devices
Deploy as native applications on Windows and macOS – Self Installation and Endpoint Management Supported.
| Agent Type | OS | Runtime | Host Support | Distribution |
|---|---|---|---|---|
SPEKTRA Edge Appliances | Linux | EdgeLQ OS | Hardware appliance | |
Static Agents For Generic Edge Devices | Linux | EdgeLQ OS | Raspberry Pi4, Dell VEP | Image provided per channel partner agreement |
Static Agents for Docker | Linux | Docker | Cisco Catalyst 9K Series Routers & Switches | Public Docker Repository |
Cloud Agents | Linux | VM with Docker Runtime | Azure, AWS, GCP | Public Docker Repository |
Mobile Agents for Windows | Windows | Native Application | Windows 10 or newer | Microsoft Store Service Experience Insights |
Mobile Agents for macOS | MacOS | Native Application | macOS 12 Monterey or newer | Download .DMG from ntt-dev.io/observability/desktop-agent-download/en |
All agents send synthetic probing traffic to internal targets within the network and internet-accessible external targets through the network. Static and cloud agents can also be configured as “managed targets” that respond to probing by other agents. This flexible capability provides the flexibility to deploy agents widely across the network to provide continuous and on-demand insights about network traffic quality to business-critical services inside and outside the network.
Probing:
SEI Controller operations:
On-demand Troubleshooting:
Metrics Data:
Logs:
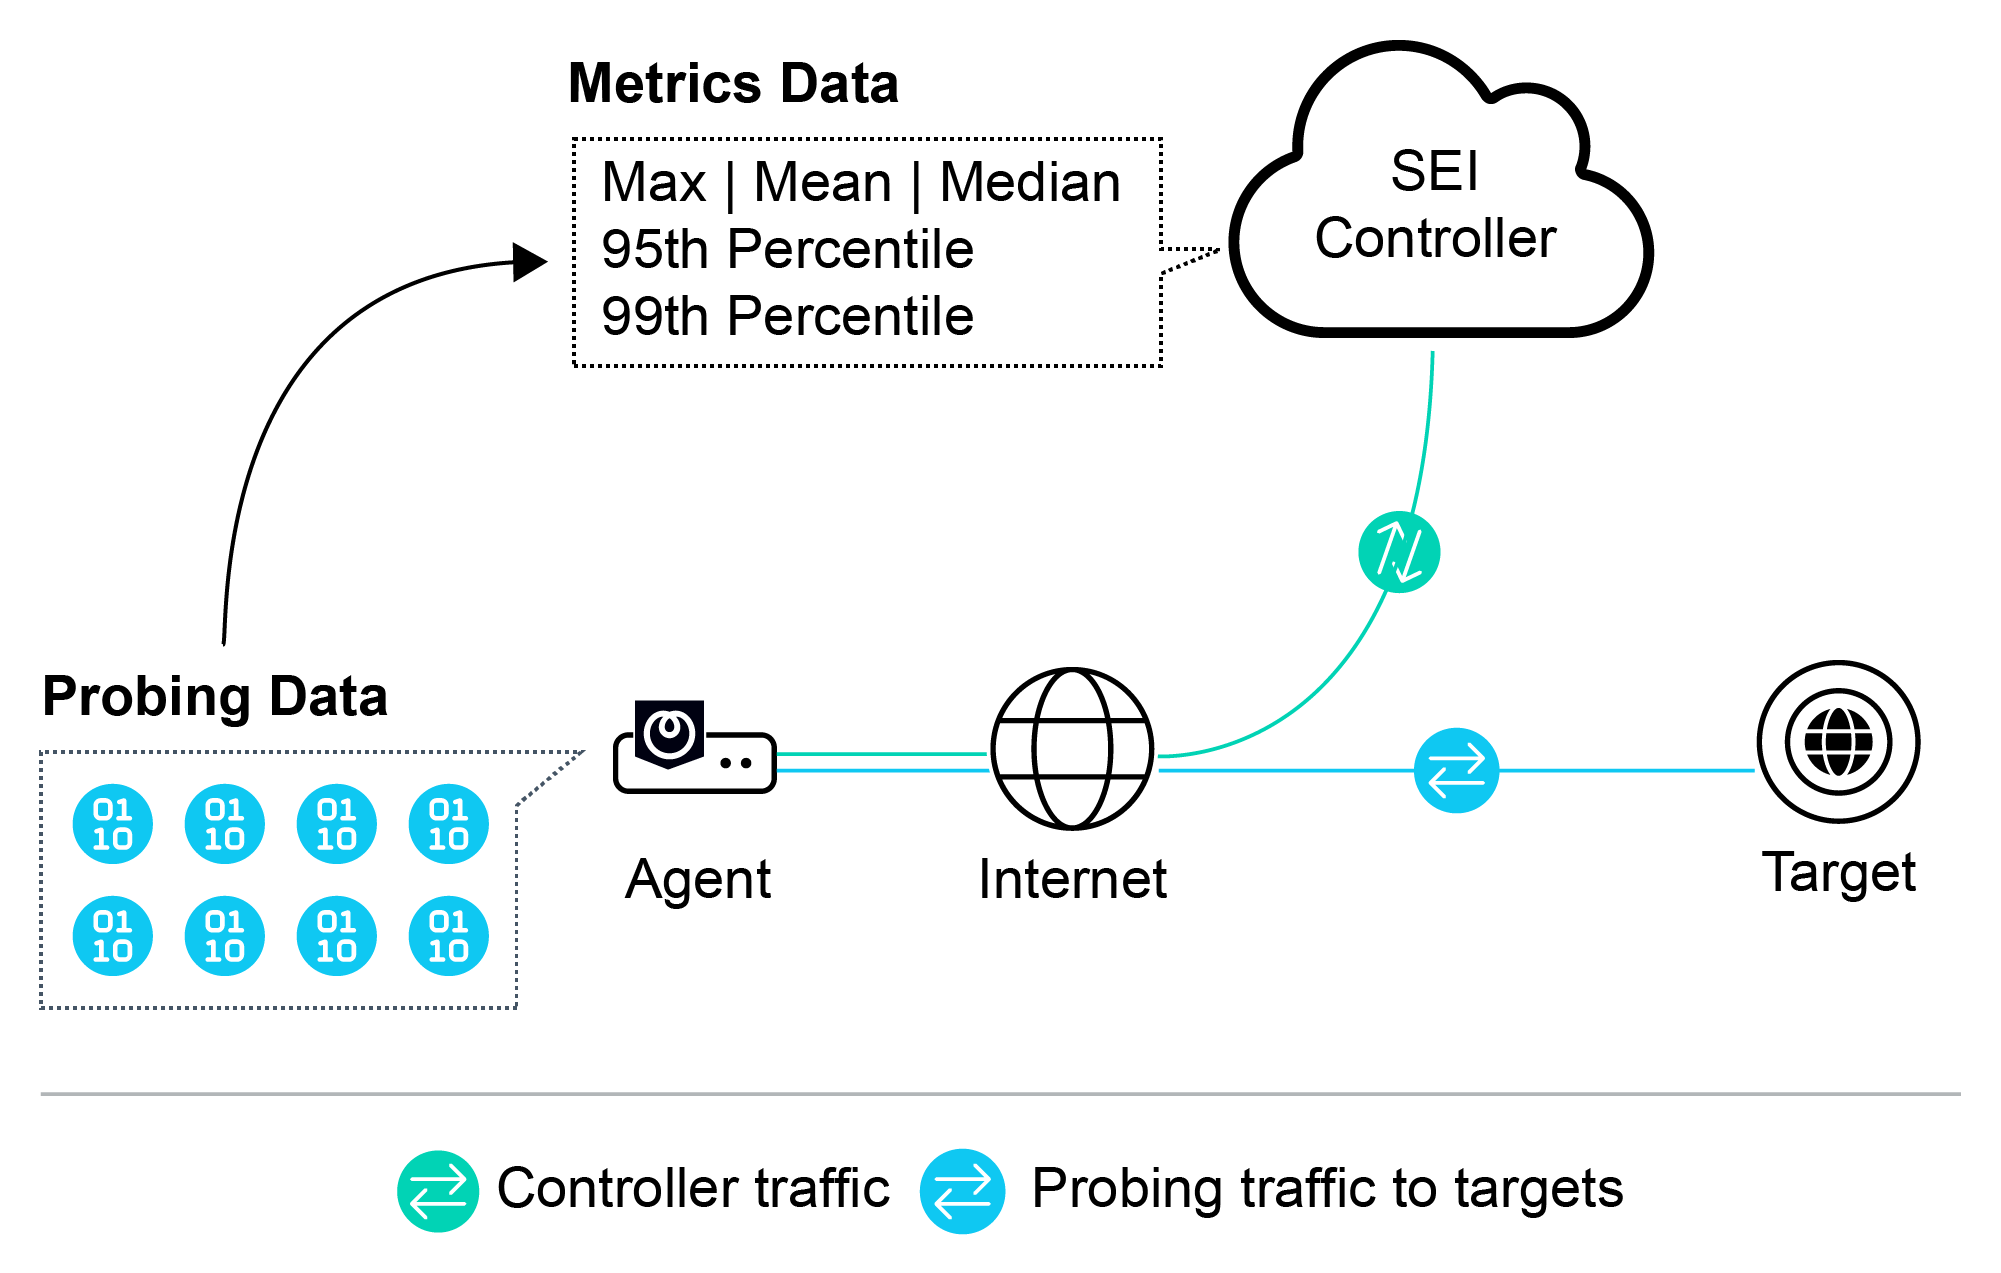
All agents provide time series metrics and on-demand troubleshooting data.
Following is a quick reference to the metrics provide by agent type. See the Metrics article for details about each type of metric.
| Metric Type | Metric | Static and Cloud Agents | Mobile Agents |
|---|---|---|---|
Probing metrics (time series) | Latency |
|
|
Jitter |
|
| |
Loss |
|
| |
HTTP Availability |
|
| |
HTTP Request Response Time |
|
| |
Path Discovery (ASN, hops latency) |
|
| |
Speed Test |
|
| |
Device metrics (time series) | CPU and Memory Usage |
|
|
Interface Loss TX and RX |
|
| |
Interface Errors TX and RX |
|
| |
WiFi Signal Strength (when connected) |
|
| |
On-demand troubleshooting (streaming) | Packet Capture |
| – |
Ping Test |
|
| |
DNS Lookup |
|
| |
HTTP Test |
|
| |
Path Discovery |
|
|
Agents perform path discovery when the agent is added to a probing distribution with path discovery enabled.
Enable path discovery and set the path probing interval in Add/Edit Probing Distribution modal.
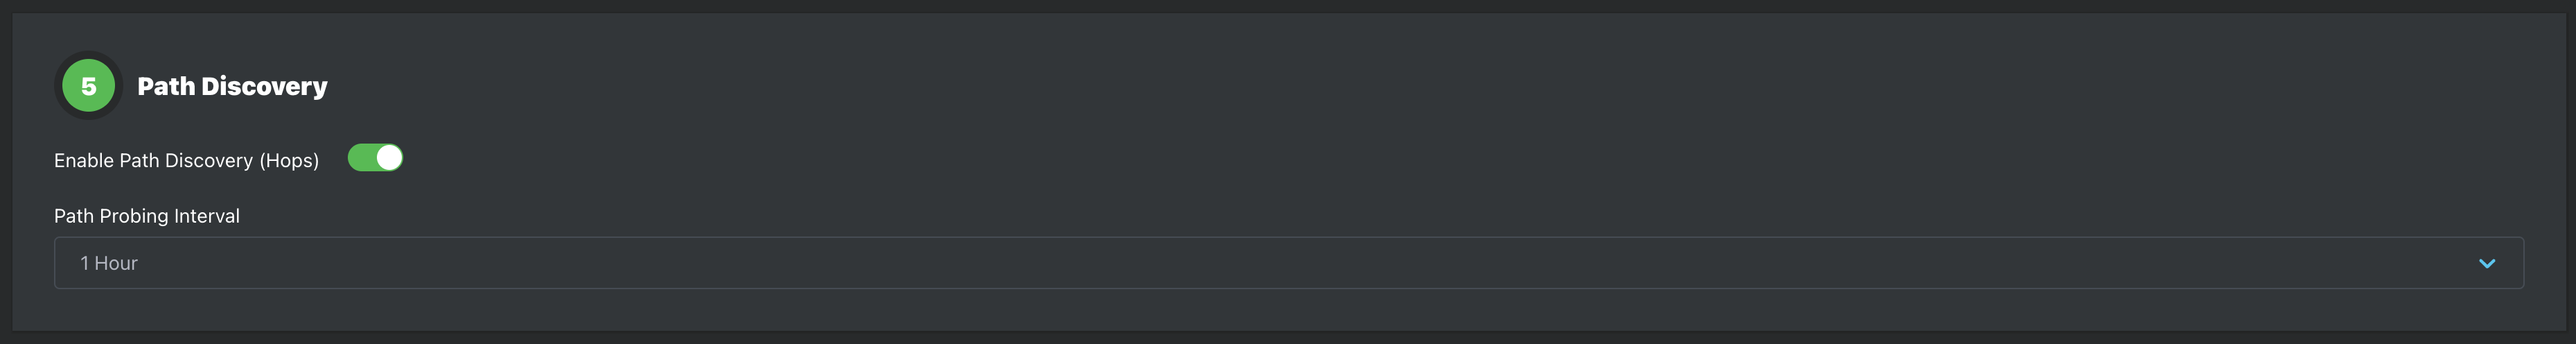
Once enabled, the path probing interval and “enabled” toggle are shown on the probing distribution page and can be toggled on and off.
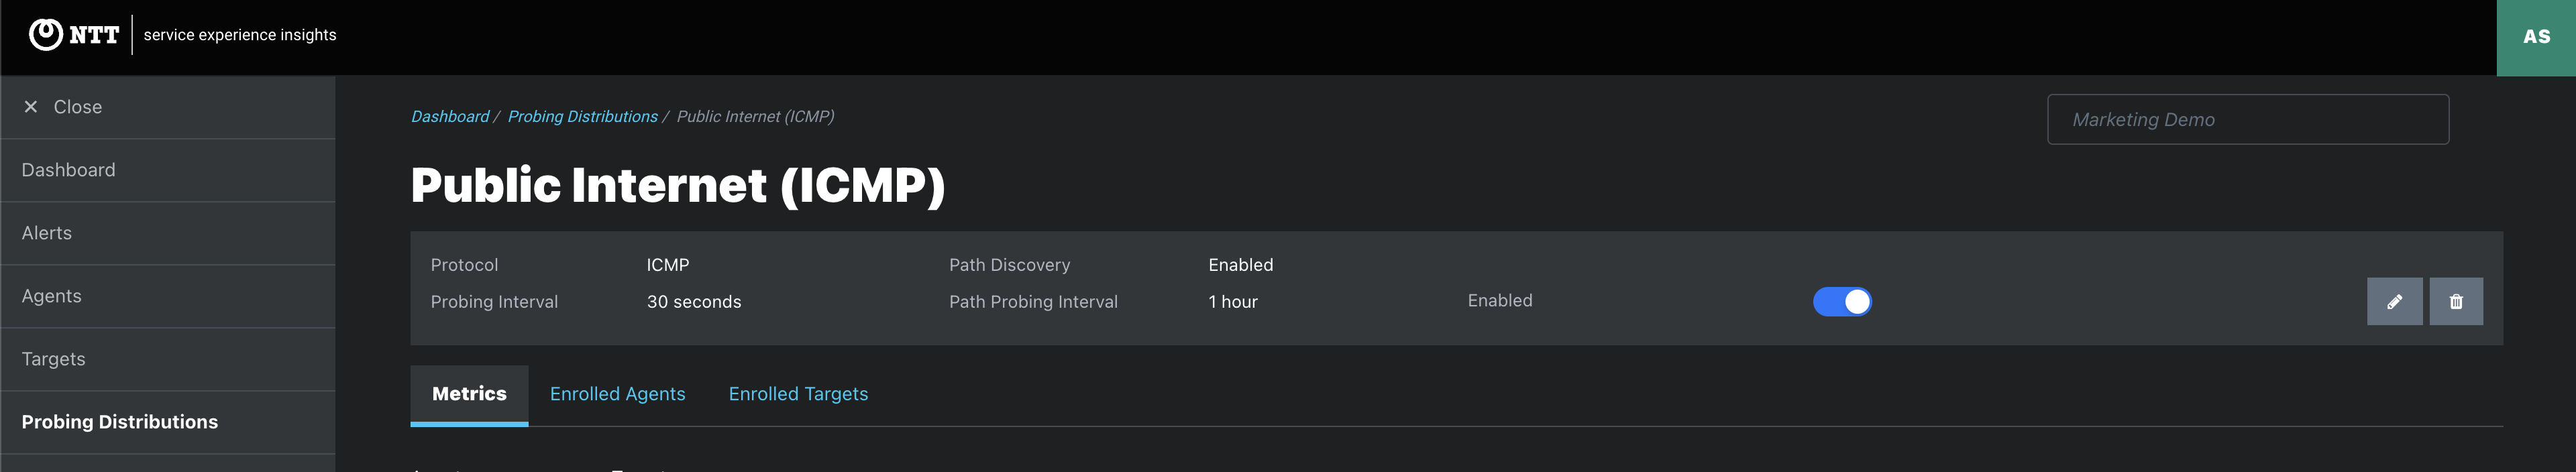
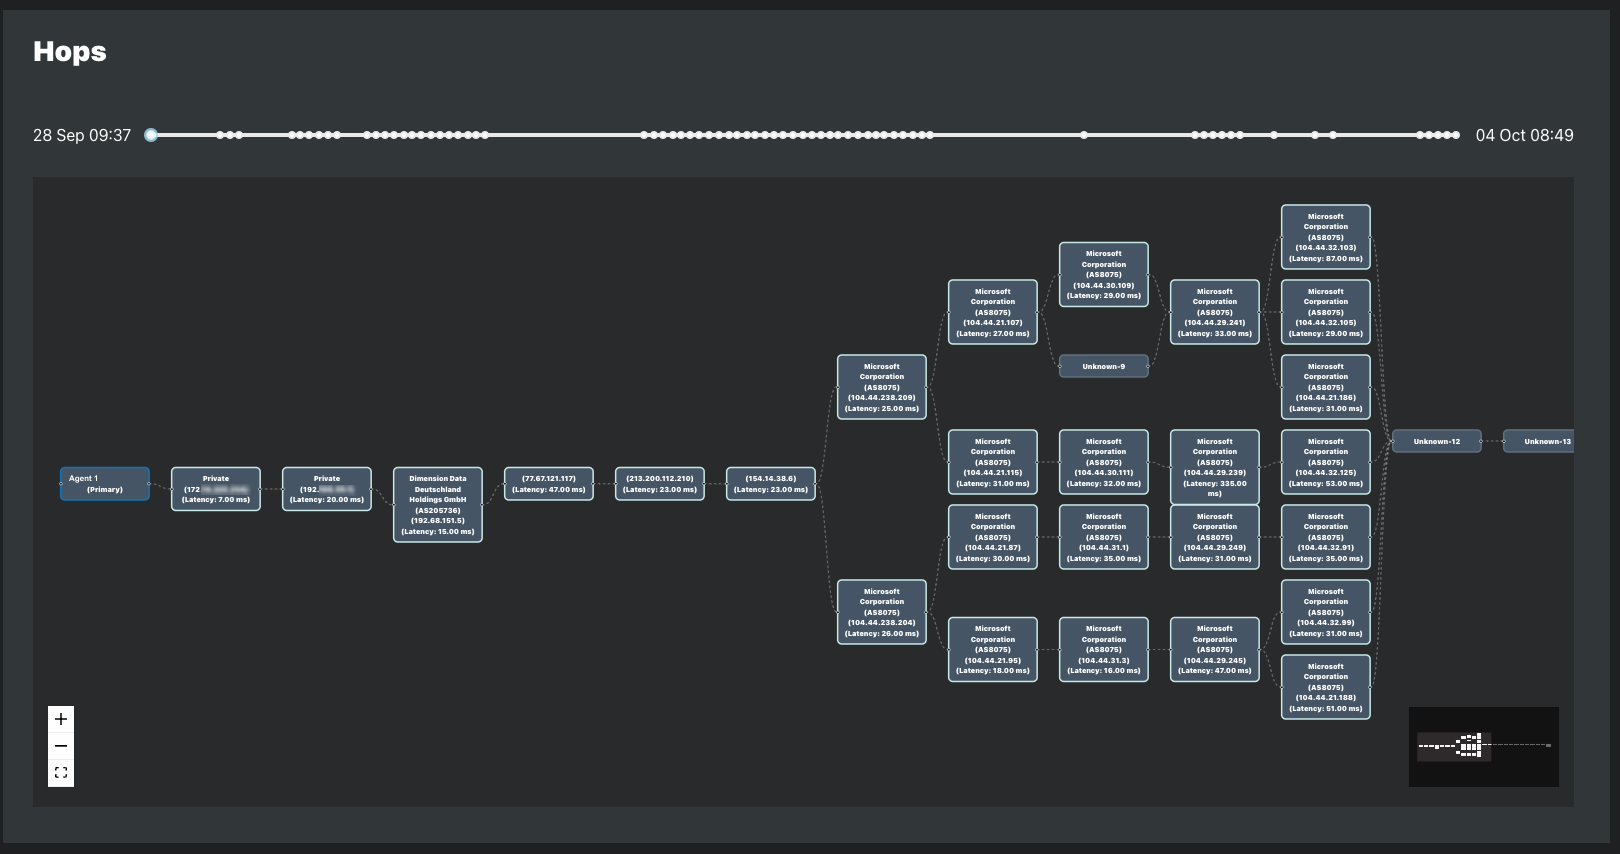
Agents perform a path probing (also referred to as traceroute) to create path discovery visualizations of the hops between the agent and the target. The path discovery visualization shows the IP and latency of each hop and the carrier ASN in use at the time.
For agents in a probing distribution with path discovery enabled, clicking a target plotline opens the path visualization for the paths probed during the time range selected.
Learn more about path discovery metrics and path probing methods in the Metrics article
**Path Discovery Triggers**
Path discovery is the product of path probing that is triggered in four ways:
1. Path Probing Interval
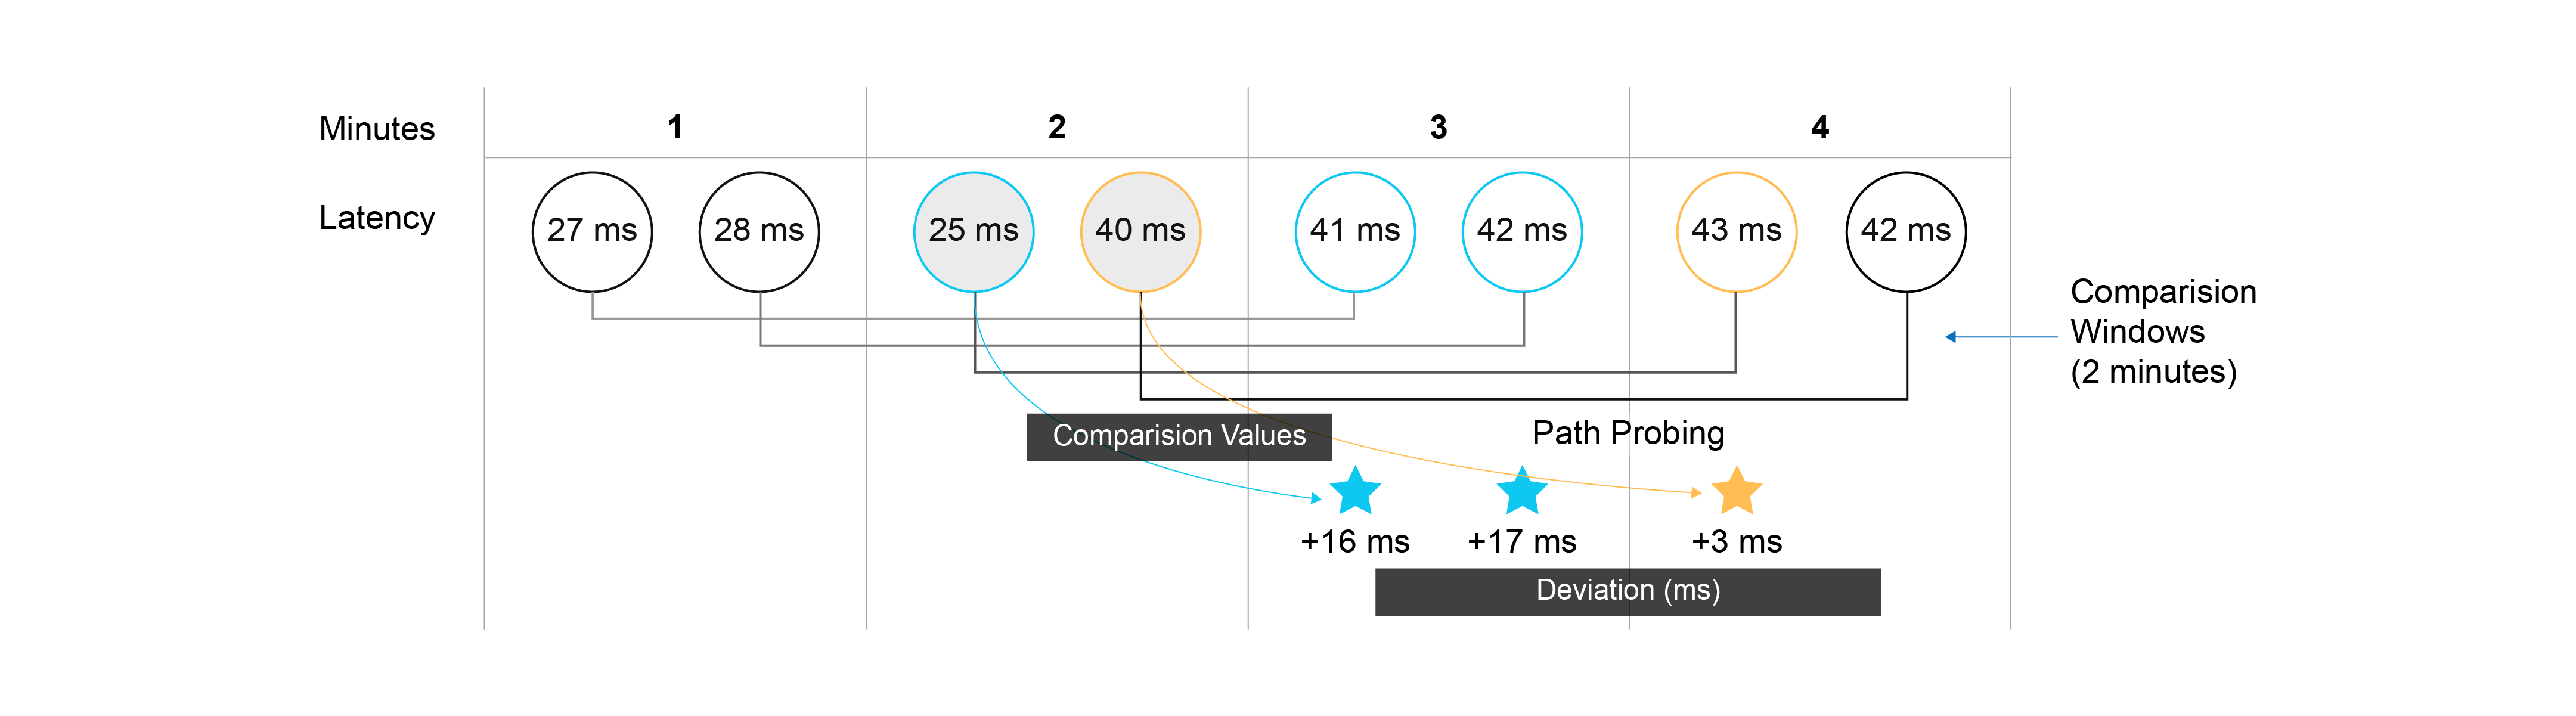
2. Latency Change
| Normal Latency | Deviation Threshold |
|---|---|
| +/- 10 ms |
35 ms to 99.99 ms | +/- 5 ms |
< 35 ms | +/- 3 ms |
The following example shows how comparison windows are used to automatically trigger path probing when latency increases.
3. Target IP change detected
4. On-demand Path Discovery:
Path probing protocols
The protocol used for path probing vary by path probing trigger, target protocol, and agent type.
| Target Protocol | Static and Cloud Agents (Linux-based) | Mobile Agent for macOS | Mobile Agent for Windows | |
|---|---|---|---|---|
Path Discovery Interval | HTTP | TCP | UDP | ICMP |
UDP | UDP | UDP | ICMP | |
ICMP | ICMP | ICMP | ICMP | |
Latency Change | HTTP | TCP | UDP | ICMP |
UDP | UDP | UDP | ICMP | |
ICMP | ICMP & UDP | ICMP | ICMP | |
On-Demand | Any | ICMP, UDP, TCP | ICMP, UDP, TCP | ICMP |
Path probing attempts
The number of attempts differs by path probing trigger.
| Number of Attempts | |
|---|---|
Path Discovery Interval | 10 |
Latency Change | 3 |
On-demand | 1-10 set by the user, 3 is the default setting |